You're sitting there, typing a natural language prompt, and watching as an AI agent writes a complex feature in seconds. It feels like magic. This is "vibe coding"-where the focus shifts from manual syntax to high-level intent. But while you're enjoying the flow, there is a silent conversation happening in the background. Your tools are talking to servers, sending back metrics, logs, and traces. The big question isn't whether data is leaving your repository, but exactly what is being shipped and who gets to see it.
When we talk about vibe coding is an AI-assisted software development approach centered on natural-language prompting rather than direct manual code authorship, we aren't just talking about a new way to write functions. We are talking about a new data pipeline. Because these tools act as agents, they need a feedback loop to know if the code they wrote actually works. This is where telemetry comes in.
The Invisible Stream: What is Telemetry?
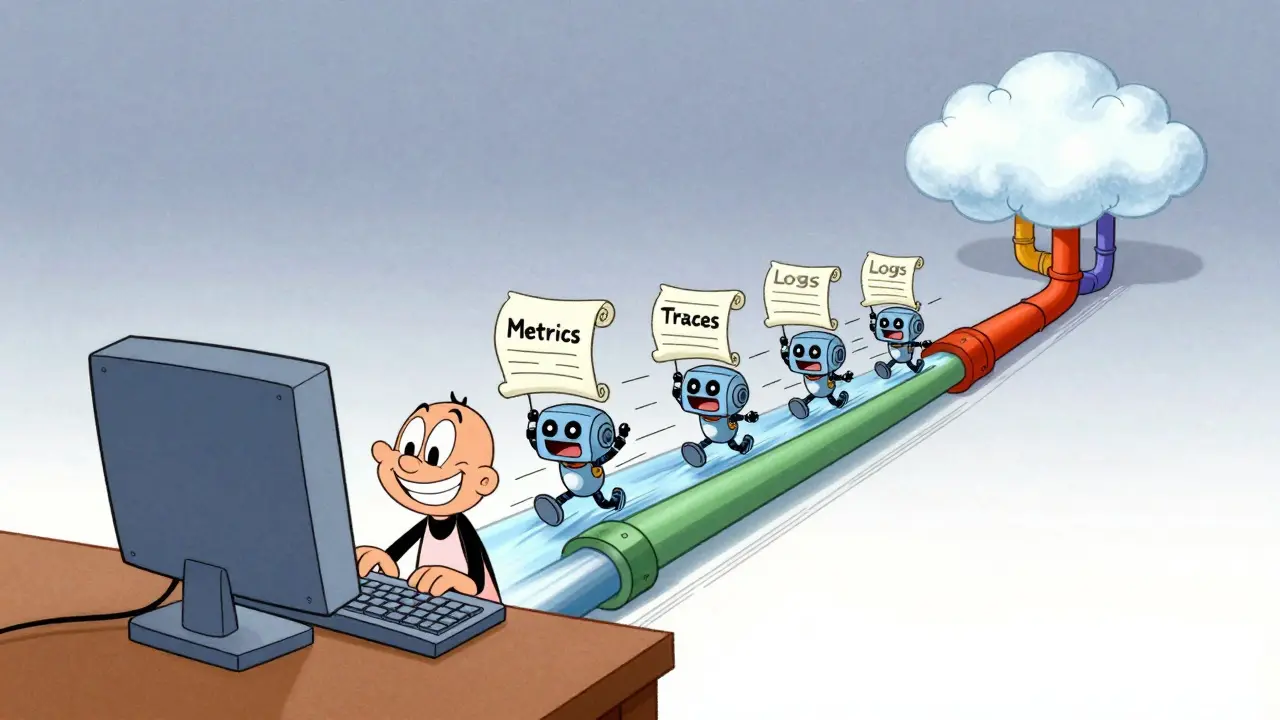
In plain English, telemetry is the automated collection of data about how a tool is performing. If you've ever wondered why an app asks to "send usage statistics," that's telemetry. In the world of AI coding, this is handled by OpenTelemetry, a vendor-neutral standard that ensures different tools speak the same language. It uses a protocol called OTLP (OpenTelemetry Protocol) to move three main types of data: metrics, logs, and traces.
- Metrics: These are the numbers. Think of them as a dashboard. They track things like how many tokens you're burning, the latency of the AI's response, and how often the tool hits an error.
- Logs: These are the diary entries. They record specific events-like "User requested a refactor of the auth module"-and provide a chronological trail of what happened.
- Traces: These are the maps. Traces show the entire journey of a request as it moves through different systems, which is vital for figuring out exactly where a generation process stalled.
For most of us, this seems harmless. But for a company handling proprietary algorithms or sensitive API keys, a "log" isn't just a line of text-it's a potential leak.
Privacy Philosophies: Claude Code vs. Gemini
Not all vibe coding tools treat your privacy the same way. There is a massive divide in how these tools handle the most sensitive part of the process: your prompts. Your prompts often contain the "crown jewels" of your project-business logic, database schemas, and internal architecture.
Claude Code, developed by Anthropic, takes a "privacy-first" approach. Their telemetry is opt-in. If you don't explicitly flip the switch by setting CLAUDE_CODE_ENABLE_TELEMETRY=1, the data doesn't flow. More importantly, they redact user prompts by default. They assume your prompts are private until you tell them otherwise.
On the other side, Gemini from Google takes a different posture. In its default configuration, GEMINI_TELEMETRY_LOG_PROMPTS is set to true. This means that unless you go into the settings and manually disable it, your prompts are being logged. It's a stark contrast: one tool assumes the prompt is a secret; the other assumes it's a data point for improvement.
| Feature | Claude Code | Gemini | Codium Codex |
|---|---|---|---|
| Telemetry Status | Opt-in (Off by default) | Environment-based | Config-file based |
| Prompt Logging | Redacted by default | Enabled by default | Log/Trace focus |
| Standard used | OpenTelemetry (OTLP) | OpenTelemetry (OTLP) | OpenTelemetry (OTLP) |
The New Danger Zone: Bidirectional Data Flows
The risk isn't just data leaving your repo; it's data coming back in and creating a loop. We're seeing the rise of the Model Context Protocol (or MCP), which allows AI agents to query external tools for context. For example, a tool like Sentry provides an MCP server that lets an AI agent fetch a trace of a crash that just happened in production.
This creates a "feedback loop." The agent writes code $ ightarrow$ the code crashes $ ightarrow$ the agent queries the telemetry server $ ightarrow$ the agent uses that telemetry to fix the code. While this makes the AI incredibly smart, it means your telemetry data is now being fed back into the LLM's context window. If your traces contain sensitive user data or internal IP addresses, that information is now being processed by the model provider to "help" you fix the bug.

How to Lock Down Your Repository
If you're using these tools in a professional environment, you can't just "vibe" with your security. You need a concrete strategy to control what leaves your machine. The best way to do this is by inserting a local collector between your tool and the internet.
Instead of sending telemetry directly to a cloud provider, configure your OTLP endpoint to http://localhost:4318. By running a local collector-such as those found in the VictoriaMetrics Stack-you can intercept the data, scrub any sensitive strings, and then decide what actually gets forwarded to the cloud. This gives you a middle ground: you get the observability you need without handing over your entire prompt history to a third party.
Another pro tip: change how you prompt. Instead of letting the tool guess how to instrument your code, be explicit. Use prompts like: "Write this handler and include OpenTelemetry spans for each major step, but do not log the request body." This puts you back in control of the telemetry definition.
Beyond the Code: Competitive Intelligence Risks
We often worry about passwords, but we forget about "process." Vibe coding allows non-experts to build incredibly complex infrastructure. For instance, using a tool like Tinybird, a single prompt can generate materialized views, anomaly detection endpoints, and data pipes.
The telemetry from these sessions reveals more than just bugs; it reveals your analytical methodology. It shows how you aggregate data, what your rolling windows are, and how you detect anomalies. To a competitor, this telemetry is a blueprint of your data strategy. If this data is flowing to a shared cloud backend with weak permissions, you're not just risking a leak-you're giving away your competitive edge.
Does vibe coding send my entire codebase to the AI?
Not usually the entire repo, but they do send "context windows." This includes the files you have open, specific snippets the agent deems relevant, and the telemetry data generated during execution. However, the telemetry itself (metrics/logs) is a separate stream from the code context.
Can I completely disable telemetry in these tools?
Yes, in most tools. For Claude Code, it's off by default. For others like Gemini, you need to set environment variables (e.g., GEMINI_TELEMETRY_ENABLED=false) or edit JSON configuration files to stop the data flow.
What is the difference between a metric and a trace?
A metric is a number (e.g., "The AI took 2.5 seconds to respond"). A trace is a journey (e.g., "The request started at the IDE, went to the API gateway, hit the LLM, and returned to the editor"). Metrics tell you something is wrong; traces tell you where it went wrong.
Is OpenTelemetry safe for enterprise use?
OpenTelemetry is just a protocol (a way of formatting data). It is safe, but the endpoint you send that data to is what matters. Sending data to a local, self-hosted collector is secure; sending it to an unencrypted HTTP endpoint on the public web is not.
How does MCP affect my data privacy?
The Model Context Protocol (MCP) allows AI agents to pull data from other tools. If you connect your AI to a Sentry MCP server, the AI can now "see" your production error logs to help fix a bug. This is powerful, but it means your production telemetry is now flowing into the AI's context.