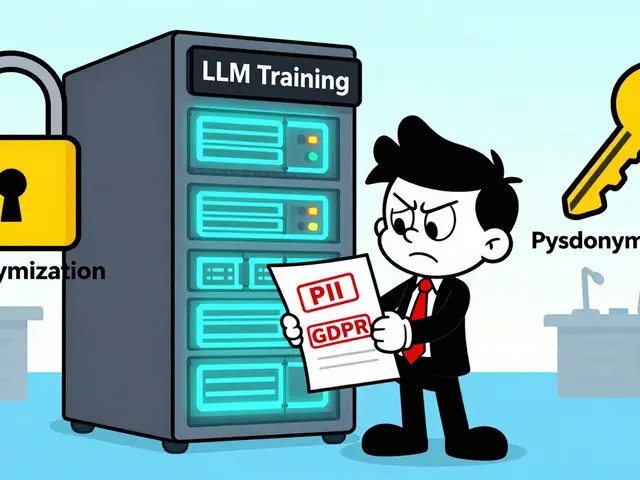
When a traditional software server crashes, you know exactly what happened. The CPU spiked, memory ran out, or a code bug caused a loop. You restart the service, and life goes on. But when your Large Language Model (LLM) starts making things up, lying to customers, or leaking sensitive data, there is no simple reboot. This is the new reality of incident management for Large Language Model failures and misuse, a specialized discipline that has become critical since enterprises began embedding generative AI into their core workflows.
Unlike deterministic code, LLMs are probabilistic. They don't just break; they drift. They hallucinate. They get tricked by clever users through prompt injection attacks. According to Galileo AI's 2024 analysis, 78% of these failures stem from problematic input data, poor prompt engineering, or integration errors rather than the model itself being 'broken' in the traditional sense. If you are an engineer or leader tasked with keeping these systems safe, you need a playbook that is fundamentally different from standard Site Reliability Engineering (SRE).
Why Traditional Incident Management Fails with AI
You might think your existing monitoring tools are enough. They aren't. Traditional systems trigger alerts based on hard thresholds-like CPU usage exceeding 90%. An LLM doesn't have a CPU threshold that indicates it is lying. It looks healthy while producing dangerous outputs.
The core problem is visibility. Zendata’s October 2024 analysis of 127 AI incidents revealed that conventional approaches missed 68% of LLM-specific failures because they lacked specialized detection mechanisms. You cannot detect a hallucination spike-defined as a greater than 15% deviation from factual accuracy in critical domains-by looking at latency logs. You need semantic understanding.
Furthermore, the complexity is layered. Galileo AI documented that 83% of LLM incidents require analysis across five or more system layers: input data, prompt engineering, model configuration, output processing, and downstream integrations. Compare this to traditional software, which usually involves analyzing only about 2.3 layers. When an LLM fails, the root cause could be a bad user prompt, a misconfigured temperature setting, or a corrupted database entry feeding the context window. Untangling this requires a new kind of observability.
Core Components of an LLM Incident Response System
To manage these risks effectively, you need a dedicated architecture. Reference implementations documented by iLert in June 2024 suggest four essential components for any robust LLM incident management system:
- Specialized AI Agents: Embedded directly in your incident flows, these agents can triage alerts faster than humans. They can query telemetry in plain English, reducing junior engineer ramp-up time by 65%, according to senior SREs in the field.
- Secure Context Layers: These ensure that sensitive data isn't leaked during the diagnostic process and that the incident response tools themselves are secure against manipulation.
- Control Planes: Operations management hubs that allow you to toggle behaviors, such as activating circuit breakers or switching models, without redeploying code.
- Comprehensive Monitoring Systems: Tools that track 15-20 specialized metrics beyond standard performance indicators.
These systems typically run on Python 3.9+ environments and integrate with major cloud monitoring platforms like Datadog, New Relic, or Splunk. However, integration is complex. Quinnox rated the implementation complexity at 7.2 out of 10 in their 2024 assessment of 47 enterprise deployments. It is not a plug-and-play solution; it requires deep architectural changes.
Detecting the Unseeable: Metrics That Matter
If you want to catch an incident before it becomes a PR nightmare, you need to monitor the right signals. Standard error rates won't cut it. Effective implementations correlate specialized LLM metrics with traditional system telemetry with 89% accuracy in identifying root causes, according to Algomox's 2024 SRE study.
| Metric | Description | Alert Threshold Example |
|---|---|---|
| Hallucination Rate | Deviation from known facts in critical domains | >15% deviation triggers review |
| Safety Boundary Violations | Outputs violating content policies | Detected via classifier models (92-98% precision) |
| Semantic Drift | Gradual shift in tone or topic relevance | Sudden change in embedding similarity scores |
| Confidence Scores | Model's self-assessed certainty | <85% confidence requires human oversight |
| Toxicity Scores | Presence of harmful or biased language | Any non-zero score in safety-critical apps |
Notice the specificity here. You aren't just watching for 'errors.' You are watching for semantic drift and toxicity scores. Modern implementations use classifier models that achieve 92-98% precision in detecting safety violations. But be warned: increasing sensitivity often increases false positives. Activating stricter content filters can increase false positive rates by 8-12%, even if it reduces harmful outputs by 63%. Finding the balance is part of the incident management strategy.

Automated Remediation: Circuit Breakers and Fallbacks
Once an incident is detected, speed is everything. Unmanaged LLM incidents cause 3.7x more widespread system impact than traditional software failures due to cascading dependencies, according to iLert. You need automated responses.
The most effective mechanism is the circuit breaker. When failure thresholds are exceeded, the system automatically triggers fallback mechanisms. Common strategies include:
- Model Downgrading: Switching from a powerful but volatile model like GPT-4 to a more conservative one like GPT-3.5 for safety-critical operations.
- Template Reversion: Reverting to static, rule-based responses instead of generative ones until the issue is resolved.
- Strict Filtering: Activating aggressive content filters that may block some valid requests to prevent any potential harm.
However, automation is a double-edged sword. Professor Michael Black of MIT warned in his July 2024 IEEE paper that over-automation creates new failure modes. In his study, 22% of remediation attempts actually worsened the original incident due to incorrect root cause analysis. For example, an automated system might incorrectly classify valid user inputs as jailbreak attempts, locking out thousands of customers-as happened in a notable August 2024 case involving 12,000 enterprise users.
This is why Google’s March 2024 SRE framework mandates human oversight for incidents with potential business impact exceeding $50,000 or affecting more than 5,000 users. Automation should handle Tier-1 issues with high pattern recognition confidence, but humans must remain in the loop for high-stakes scenarios.
Building Your Incident Response Playbook
Implementing this infrastructure takes time. Don't expect overnight results. Organizations typically spend 2-3 weeks evaluating their current maturity, followed by 8-12 weeks for basic observability setup. Full automation capabilities require 5-7 months, according to Quinnox case studies.
Your first step is to establish baseline confidence thresholds. Google’s guidelines suggest a minimum of 85% confidence for safe automation. Below that, human intervention is required. Next, implement feature flags for controlled rollouts of autonomous execution. This allows you to test remediation actions in a sandbox before applying them globally.
You also need the right team. Skills shortages are acute. Gartner reported in October 2024 that 68% of companies struggle to find engineers with both SRE and LLM expertise. Aim for 1-2 dedicated AI incident specialists per 10-person AI engineering team. These individuals need to understand fine-tuning, integration development, and traditional reliability engineering.
The Regulatory Push and Market Reality
You are not doing this in a vacuum. Regulatory pressure is accelerating adoption. The EU AI Act’s September 2024 enforcement deadline accelerated adoption by 28 percentage points in European enterprises. Financial services (52% adoption) and healthcare (48%) are leading the way due to strict compliance requirements.
The market for LLM incident management is projected to reach $2.8 billion by 2026, growing at a 42% CAGR. Competitive options range from established AIOps vendors like Datadog and Splunk adding LLM-specific capabilities, to specialized startups like Galileo AI and WhyLabs, and open-source frameworks like LangSmith and TruLens.
However, standardization remains a challenge. Only 29% of organizations use consistent hallucination measurement approaches. This lack of standard metrics makes cross-team communication difficult. As you build your program, define your own internal standards for what constitutes a 'failure' versus a 'minor anomaly.'
FAQ
What is the difference between traditional incident management and LLM incident management?
Traditional incident management deals with deterministic failures like server crashes or code bugs, using metrics like CPU usage and error rates. LLM incident management handles probabilistic failures like hallucinations, safety violations, and prompt injections. It requires semantic analysis, multi-layer correlation across input/output pipelines, and specialized metrics like confidence scores and toxicity levels, which traditional tools cannot detect.
How quickly do LLM incidents spread compared to traditional software failures?
Unmanaged LLM incidents cause 3.7x more widespread system impact than traditional software failures. This is due to cascading dependencies in modern architectures where AI outputs feed into multiple downstream systems, amplifying errors rapidly if not caught early by specialized observability layers.
What are the key metrics I should monitor for LLM health?
Beyond standard latency and error rates, you should monitor hallucination rates (deviation from facts), safety boundary violations (policy breaches), semantic drift (tone/topic shifts), confidence scores (model certainty), and toxicity scores (harmful language). Effective systems correlate these with traditional telemetry to identify root causes with high accuracy.
Is it safe to fully automate LLM incident response?
No. Over-automation creates new risks. Studies show that 22% of automated remediation attempts can worsen incidents due to incorrect root cause analysis. Best practices recommend hybrid approaches: automate low-impact, high-confidence issues (Tier-1), but maintain human oversight for incidents with significant business impact or novel failure modes.
How long does it take to implement an LLM incident management system?
Implementation is a phased process. Initial evaluation takes 2-3 weeks. Basic observability and alert categorization require 8-12 weeks. Achieving full automation capabilities typically takes 5-7 months. Success depends on integrating with existing telemetry systems, establishing confidence thresholds, and having staff with both SRE and LLM expertise.