
Ever asked an AI coding assistant to "fix the lag" only to get back a generic suggestion like "use a better algorithm"? It’s frustrating. You know your app is slow, but pinpointing exactly why requires more than just asking nicely. Performance profiling isn't magic; it's data. And if you want an AI to help you optimize code, you need to feed it the right kind of data through precise prompts.
In 2026, developers are using Large Language Models (LLMs) not just to write code, but to debug complex system bottlenecks. The key difference between a mediocre fix and a breakthrough optimization lies in how you structure your request. This guide breaks down how to prompt for effective performance profiling and actionable optimization plans, turning vague complaints into concrete engineering solutions.
Why Vague Prompts Fail at Performance Tuning
Think about what happens when you say, "My code is slow." An AI has no context. Is it slow because of a database query? A memory leak? Inefficient CPU cycles? Without specific metrics, the model hallucinates likely culprits based on general training data, often suggesting optimizations that don’t apply to your specific stack or architecture.
Performance issues usually stem from one of three places:
- CPU Bound: The processor is maxed out doing calculations.
- Memory Bound: The system is spending too much time moving data around or allocating/deallocating memory.
- I/O Bound: The code is waiting on disk reads, network requests, or database responses.
If your prompt doesn’t identify which bucket the problem falls into, the AI will guess wrong. For example, optimizing a CPU-bound loop won’t help if your bottleneck is actually a slow API response. You need to bridge the gap between raw profiler output and AI understanding.
The Anatomy of a High-Performance Prompt
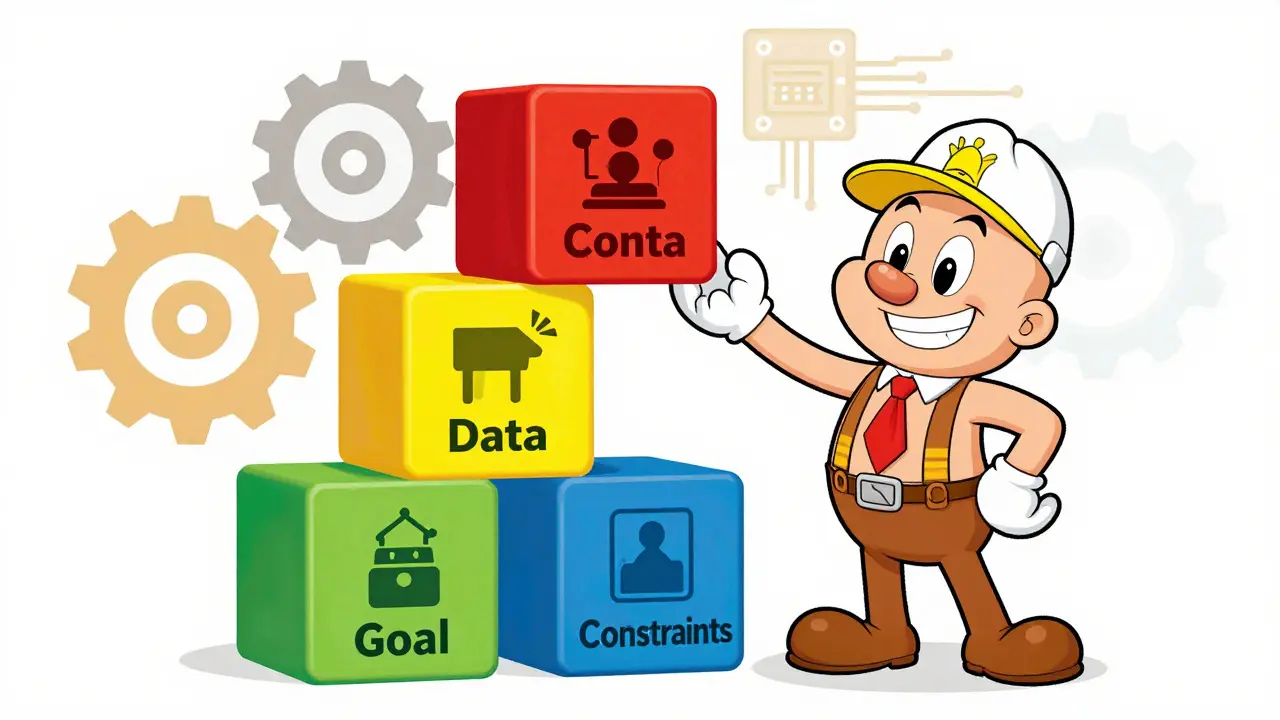
To get a useful optimization plan, your prompt needs four distinct components: Context, Data, Constraints, and Goal. Let’s break them down with examples.
1. Set the Technical Context
Tell the AI what language, framework, and environment you’re using. Python behaves differently than C++, and React renders differently than Vue. Mentioning your specific version matters too-Python 3.12 handles certain operations faster than 3.9 due to internal changes.
2. Provide Concrete Profiler Data
This is the most critical step. Don’t describe the slowness; show the numbers. Copy-paste relevant snippets from tools like:
- Intel VTune for CPU hotspots.
- NVIDIA Nsight Systems for GPU utilization.
- Chrome DevTools for web rendering bottlenecks.
- Python cProfile for function call counts and times.
Include the top 5-10 functions by execution time. If a function takes 85% of the total runtime, highlight that. As Trimble Maps Engineering found in 2023, proper profiling configurations can reveal that specific code paths consume the vast majority of execution time. Giving the AI this hierarchy helps it prioritize fixes that yield the biggest bang for their buck.
3. Define Hardware and Scale Constraints
Optimization depends heavily on where the code runs. Are you targeting high-end servers with AVX-512 support, or low-end mobile devices with limited RAM? Mentioning these constraints prevents the AI from suggesting heavy libraries that would crush your target hardware. For instance, Harvard Research Computing noted that leveraging CPU-specific features like AVX-512 can yield massive speedups, but only if the hardware supports it and the compiler flags are set correctly.
4. State the Specific Goal
Do you want to reduce latency? Increase throughput? Lower memory usage? Be explicit. "Reduce frame time from 33ms to 22ms" is a far better goal than "make it faster." Unity saw significant improvements in titles like 'Hollow Knight: Silksong' by setting clear frame-time targets and drilling down into GPU optimization specifically for those metrics.
Step-by-Step: Building Your Optimization Prompt
Here is a practical template you can adapt. Replace the bracketed info with your details.
- Role Assignment: "Act as a Senior Performance Engineer specializing in [Language/Framework]."
- Problem Statement: "My application experiences [specific symptom, e.g., high latency during user login]."
- Data Injection: "Here is the output from my profiler tool ([Tool Name]): [Paste Top Functions/Call Stack]. Note that Function X accounts for 40% of total execution time."
- Environment Details: "Running on [OS/Hardware Specs]. Using [Library Versions]."
- Constraint Checklist: "We cannot change the database schema. We must maintain backward compatibility with API v1."
- Requested Output: "Provide a prioritized list of 3 optimization strategies. For each, explain the expected impact on performance and provide a code snippet demonstrating the fix."
Common Pitfalls to Avoid
Even with good data, prompts can go sideways. Watch out for these traps:
Ignoring Measurement Distortion: Instrumenting profilers add overhead. If a routine is very short, the act of measuring it might make it look slower than it really is. SmartBear’s analysis showed instrumenting profilers can add 5-15% overhead. When prompting, mention if you used sampling vs. instrumentation. Sampling profilers have less than 1% overhead but provide approximate data. Telling the AI, "This data comes from a sampling profiler," helps it interpret anomalies correctly.
Overlooking Debug Flags: Running a profiler in Debug mode often includes extra checks and assertions that skew results. Epic Games’ internal benchmarking showed Debug configurations can skew timing by 18-25%. Always profile in Release or Production-like builds. If you haven’t, admit it in the prompt: "Note: These timings are from a Debug build, so they may be inflated."
Focusing on Minor Bottlenecks: Don’t ask the AI to optimize a function that takes 2% of the runtime while ignoring the one taking 50%. Prioritize based on the Pareto Principle (80/20 rule). Ask the AI to focus on the "top offenders relative to frame time" or total execution time.
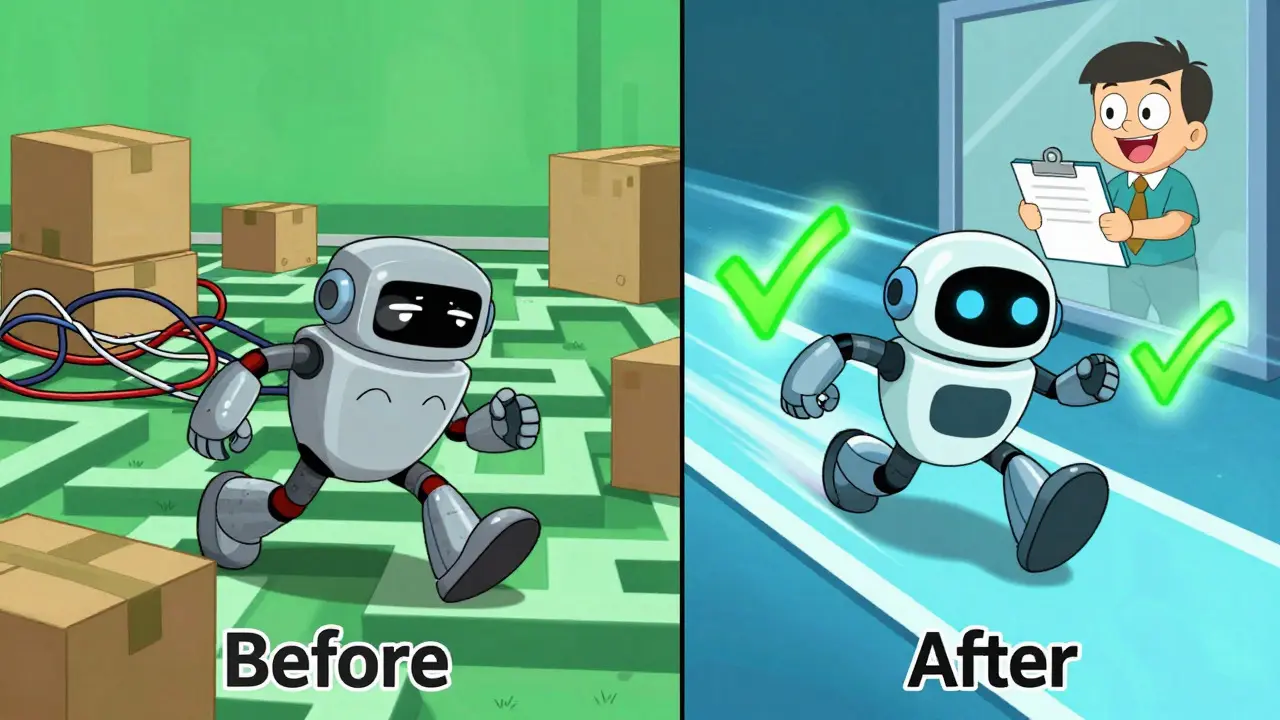
Real-World Example: Optimizing a Python Data Pipeline
Imagine you have a Python script processing large datasets. It’s taking 17 seconds to run. You ran `cProfile` and found that a specific filtering function dominates the time.
Bad Prompt: "Make this Python code faster."
Good Prompt: "I’m using Python 3.11 to process CSV files. My current script takes 17.8 seconds. Here is the cProfile output showing that the `filter_records` function consumes 12 seconds (67% of total time). The dataset contains 1 million rows. I am running on a standard laptop with an Intel i7 processor. Please suggest vectorization techniques using Pandas or NumPy to replace the loop in `filter_records`. Show the before and after code."
This prompt gives the AI everything it needs: the language version, the specific bottleneck, the percentage of time spent, the hardware context, and the desired method (vectorization). The result is likely to be a concrete code change that leverages underlying C libraries in NumPy, potentially cutting that time significantly.
Validating the AI’s Suggestions
Never trust an AI’s optimization blindly. Always measure before and after. Use the same profiler settings for both tests. If the AI suggests changing an algorithm, ensure it doesn’t introduce bugs. Run your test suite. If the AI suggests a library change, check its dependencies and size impact. Remember, optimization is iterative. One fix might shift the bottleneck elsewhere. Re-profile after every major change.
What is the best profiler to use for prompting AI?
There is no single "best" tool; it depends on your stack. For web apps, Chrome DevTools or Lighthouse is ideal. For backend services, consider Py-Spy for Python, VisualVM for Java, or perf for Linux systems. For game engines, Unity Profiler or Unreal’s Stat commands are standard. The key is choosing a tool that provides function-level timing data, which AI models can parse effectively.
How much overhead does profiling add?
It varies by method. Sampling profilers typically add less than 1% overhead, making them nearly invisible. Instrumenting profilers, which insert code at function boundaries, can add 5-15% overhead. This distortion can mislead AI if not accounted for. Always mention the type of profiler used in your prompt so the AI can adjust its recommendations accordingly.
Should I prompt for micro-optimizations?
Generally, no. Focus on macro-optimizations first-algorithmic changes, database query improvements, and caching strategies. Micro-optimizations (like swapping a variable type) rarely yield significant gains unless they are inside tight loops executed millions of times. Ask the AI to prioritize changes that impact the largest portion of execution time.
Can AI detect memory leaks?
Yes, if you provide heap dump data or memory allocation logs. Tools like Valgrind or Chrome’s Memory tab generate snapshots of object retention. Paste the retained tree or allocation timeline into your prompt, and ask the AI to identify objects that are growing unexpectedly over time. It can often spot patterns like circular references or unclosed resources.
Is it safe to let AI rewrite optimized code?
Proceed with caution. AI-generated optimized code can sometimes be harder to read or introduce subtle logic errors. Always review the changes manually. Ensure the new code passes all unit tests. Treat AI suggestions as drafts rather than final production-ready code. Human oversight remains crucial for maintaining code quality and correctness.


finally someone said it. most devs just throw code at the ai and wonder why they get garbage back. giving actual profiler data is the only way to get useful results
oh wow another guide on how to use ai properly. ground breaking stuff here folks
i mean sure if you have the time to run vtune and parse the output maybe this works but let's be real most of us just want to paste our broken code and hit enter. who has time for all this context setting nonsense? i guess we are all senior performance engineers now apparently
this whole premise is flawed. ai models are terrible at understanding system architecture anyway so feeding them raw numbers doesn't help much. they still hallucinate solutions that don't compile. i tried this with a rust backend last week and got suggestions for python libraries. waste of time honestly
actually the issue isn't just the prompt structure but the model version you are using. newer models handle context windows better so they can ingest larger profiler dumps without losing track of the main bottleneck. also you mentioned avx-512 but didn't specify compiler flags which is crucial for intel chips. most people forget about -march=native. without that your optimization plan is useless regardless of how good your prompt is. also cprofile in python is notoriously bad for io bound tasks so you should use py-spy instead as mentioned in the faq but nobody reads the faq
i actually tried this approach yesterday for a react app that was lagging during scroll events. pasting the chrome devtools flame graph summary really helped narrow down the re-render cycles. it saved me hours of guessing
good read