
Most Generative AI projects fail not because the tech is bad, but because teams measure the wrong things. According to MIT’s "State of AI in Business Report," fewer than 5% of these initiatives reach production. Why? Because leaders often track vanity metrics instead of real business impact. If you are using AI for marketing, you likely feel the pressure to produce more content faster. But does speed actually equal revenue? The answer lies in measuring A/B testing velocity and asset output correctly.
This isn't just about churning out blog posts. It's about creating a feedback loop where AI generates variations, tests them rapidly, and feeds data back into strategy. When done right, this shifts your team from reactive content creation to proactive optimization. Let's look at how to measure this shift so you can prove the value of your AI investments.
Why Traditional Metrics Fail in the Age of Generative AI
Standard marketing KPIs like page views or basic engagement rates don't tell the whole story when AI is involved. These metrics lag behind actual operational changes. You need new indicators that capture both efficiency and effectiveness. Google Cloud notes that success requires tracking model accuracy, operational efficiency, and user engagement simultaneously.
Consider the difference between manual and AI-assisted workflows. Before AI, a team might take two hours to draft a single ad copy variation. With Generative AI, that time drops to minutes. This reduction allows for ten times more variations in the same timeframe. But if you only measure total output volume, you miss whether those extra assets actually perform better. You risk flooding channels with mediocre content that dilutes brand quality.
The core problem is alignment. Many teams implement AI without defining what "success" looks like beyond "more stuff." Without clear baselines, you cannot determine if increased output translates to improved performance. This gap leads to wasted resources and stalled projects. To fix this, you must tie every AI task to a specific business objective, such as reducing cost per lead or increasing conversion rates.
Measuring Asset Output Velocity and Quality
Asset Output capacity has exploded. Organizations using AI-assisted development report average conversion rate improvements of 25%, with some specialized cases seeing lifts over 200%. This jump comes from being able to test more ideas quickly. However, quantity means nothing without quality control.
You should track three key productivity metrics:
- Content Production Time Reduction: Measure the percentage drop in time required to create standard assets. If a blog post took 4 hours and now takes 1 hour, that’s a 75% efficiency gain.
- Task Automation Percentage: Calculate how many routine tasks (like resizing images or writing meta descriptions) are fully handled by AI. Higher percentages free up humans for strategic work.
- Content Coverage Score: Evaluate how thoroughly AI tools address critical marketing topics. This ensures breadth of coverage across different customer segments.
These metrics directly correlate with A/B Testing Velocity. Velocity is the speed at which you generate, launch, and iterate on creative variations. High velocity means you can identify winning messages faster. For example, if you can test 50 headlines in a week instead of 5, you find the best performer much sooner. This reduces the time-to-optimization cycle significantly.
The Economics of AI-Driven Content Production
Let’s talk money. The primary justification for adopting AI is usually cost savings. But generic "cost reduction" claims are vague. You need precise economic indicators tied to asset production.
| Metric | Traditional Workflow | AI-Assisted Workflow | Impact |
|---|---|---|---|
| Cost Per Asset | High (Labor intensive) | Low (Automated generation) | Direct margin improvement |
| Time to Launch | Days/Weeks | Hours | Faster market response |
| Variation Volume | Limited (Resource constrained) | High (Scalable) | Better test coverage |
| Cost Per Lead (CPL) | Baseline | Reduced | Higher ROI on spend |
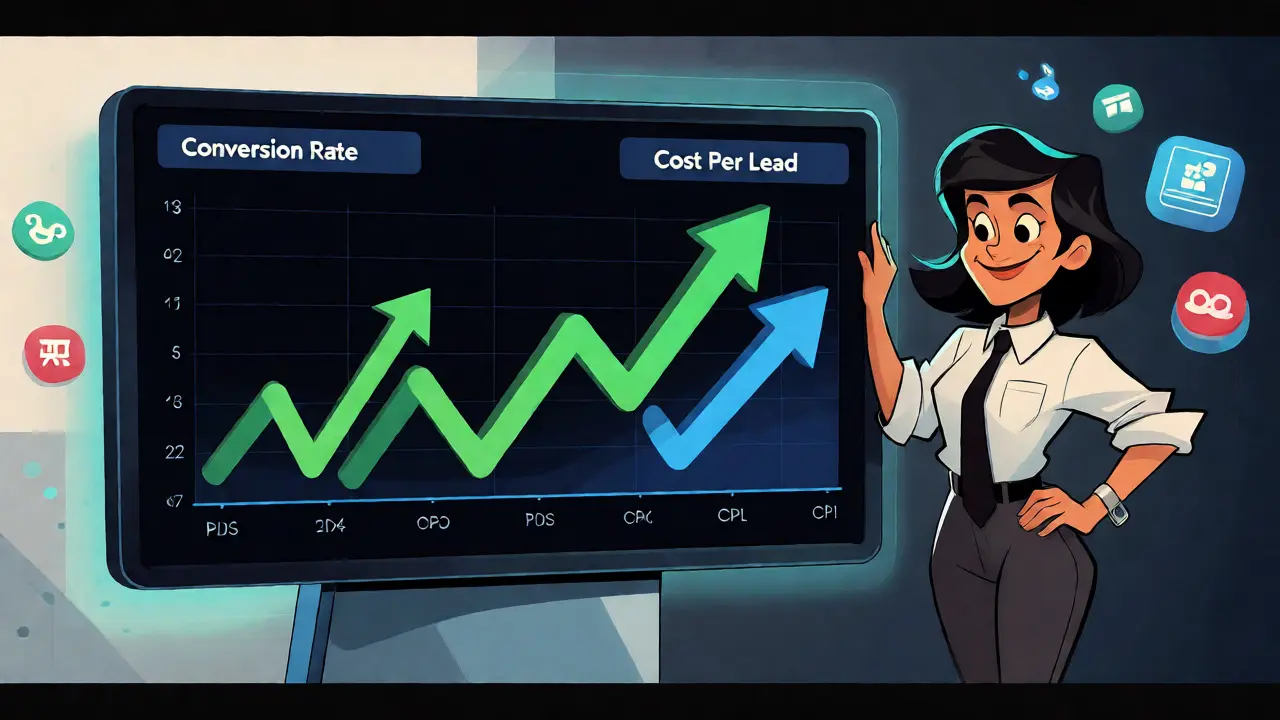
Cost Per Lead (CPL) is a critical indicator. Lower CPLs indicate that AI effectively attracts potential customers at reduced cost. This happens because AI optimizes targeting and messaging automatically. Additionally, monitor operational costs related to marketing operations. Decreases here reflect better resource utilization. By refining processes through AI, you lower costs per content piece while expanding output capabilities. This is vital for high-velocity testing programs that require multiple asset variations.

Linking A/B Testing Velocity to Business Outcomes
Speed alone doesn’t drive revenue. Conversion does. Engagement and conversion metrics measure the business impact of AI-generated assets. When you run rapid A/B testing cycles enabled by AI’s content generation velocity, you reveal which asset variations drive measurable outcomes.
Track these engagement signals:
- Click-Through Rate (CTR): Higher CTRs for AI-generated content suggest relevance and compelling messaging.
- Engagement Rate: User interactions with AI-driven campaigns show resonance with target audiences.
- Conversion Rate: The percentage of engaged users who take desired actions. This confirms if AI-driven engagement drives sales.
Customer satisfaction scores (CSAT) and Net Promoter Scores (NPS) also matter. They provide broader indicators of how AI-optimized experiences impact loyalty. If AI helps personalize product recommendations via systems like Product Advisor, it boosts Customer Lifetime Value (CLV). Personalized offers maximize long-term value from each customer. This capability relies on AI generating personalized content assets at scale, enabling tests of different personalization approaches across segments.
Optimizing Customer Acquisition Costs Through AI
Customer Acquisition Cost (CAC) efficiency improves through AI-powered marketing personalization. CAC measures the total cost of acquiring new customers. Teams leverage AI to personalize efforts and target audiences efficiently using real-time insights into lead behavior.
Sales representatives use AI-powered insights to engage prospects more effectively, streamlining the process and reducing time to close deals. This improved CAC efficiency results partly from AI’s ability to rapidly generate multiple content variations for different audience segments. Teams identify and scale the most cost-effective messaging approaches through continuous testing.
Another middle-funnel metric is the MQL to SQL conversion rate. AI-powered systems engage leads in real time with personalized interactions. Better understanding of products and customer needs moves leads through the funnel faster. This improvement is enabled by AI’s rapid asset generation, allowing targeted content for different funnel stages. Testing these variations identifies the most conversion-effective approaches.
Establishing Baselines and Measurement Frameworks
You can't manage what you don't measure. Establishing baselines is essential. Capture current performance across areas you seek to improve before deploying AI. Record average time to task completion, support ticket volumes, and existing conversion rates.
For asset velocity specifically, document baseline content production timelines. Without this, you cannot quantify the change. Define success criteria by tying AI projects to specific business objectives. For instance, aim to reduce support costs by 15% or increase conversion rates by 10%. Instrument analytics and monitoring systems to track these goals.
Create comprehensive dashboards that track both technical metrics (response time, error rate) and business metrics (revenue lift, cost savings). This integrated approach helps teams understand if AI systems function properly and deliver value. Regularly review results to enable data-driven adjustments. Organizations implementing these frameworks transform AI adoption from short-lived experimentation into sustained momentum for improved marketing performance.
Frequently Asked Questions
What is A/B testing velocity?
A/B testing velocity refers to the speed at which a marketing team can generate, launch, and analyze multiple variations of creative assets. Generative AI increases this velocity by automating the creation of copy, images, and layouts, allowing teams to run dozens of tests in the time it previously took to run one.
How does Generative AI impact asset output?
Generative AI dramatically expands asset output capacity by reducing production time and labor costs. It enables marketers to produce high volumes of diverse content variations, such as blog posts, ads, and emails, at a fraction of the traditional time and cost, facilitating broader market coverage and more frequent testing opportunities.
Why do most GenAI marketing projects fail?
According to MIT research, fewer than 5% of generative AI projects reach production. Most fail because they lack clear success metrics aligned with business objectives. Teams often focus on technological novelty rather than measurable improvements in efficiency, cost reduction, or revenue growth.
What are the key KPIs for AI-driven marketing?
Key KPIs include Content Production Time Reduction, Task Automation Percentage, Cost Per Lead (CPL), Click-Through Rate (CTR), Conversion Rate, and Customer Lifetime Value (CLV). These metrics collectively measure operational efficiency, cost savings, and business impact.
How does AI affect Customer Acquisition Cost (CAC)?
AI lowers CAC by enabling precise targeting and personalized messaging at scale. It reduces the time and resources needed to create effective campaigns, allowing teams to identify high-performing segments quickly and optimize spending toward channels and messages that yield the best return.



Oh, please. Spare me the corporate fluff about "vanity metrics" and "proactive optimization." You're just dressing up a data-scraping script in a tuxedo and calling it intelligence. The real issue isn't that leaders track the wrong things; it's that they are too incompetent to understand what they are looking at. This entire article is a masterclass in saying nothing with maximum word count.
Actually, if you look at the MIT report referenced, the failure rate is specifically tied to integration issues, not just metric selection. Most teams fail because they treat AI as a plug-and-play solution rather than a workflow overhaul. You have to restructure the approval chains first. Otherwise, yes, you are just generating garbage faster.
Wait... wait, stop!!! Did anyone else catch the implication here?! Fewer than 5% reach production! That means 95% of us are being lied to by Big Tech! They want us to buy these tools so they can harvest our creative soul while we drown in mediocre content!! It’s a conspiracy to lower human value!!! We need to fight back against the algorithm overlords before they replace our very thoughts!!! I feel sick reading this because it confirms my worst fears about surveillance capitalism eating marketing whole!!!
Wow, Michelle, calm down a little bit? 😅 The tech is just a tool, buddy. If you use it right, it frees you up for actual strategy. No one is replacing your thoughts, just the boring parts like resizing images. Let's focus on how to make the team work better together instead of panicking about robots taking over the world. We got this!
I totally agree with Vishnu here, honestly, because when I started using these tools last quarter, I realized that the biggest win wasn't even the speed, it was the fact that I finally had time to think about the brand voice without getting bogged down in the minutiae of meta tags and alt text which used to take me hours every single day, and now I can actually sit down and strategize on why we are posting what we are posting, which feels way more valuable than just pumping out volume for the sake of volume, you know?
Yesss!! Exactly Jeff!! Stop waiting for perfect and start testing NOW!! The data doesn't lie but people do!! Go crush those KPIs!!
Nice breakdown. I've seen similar results in my own workflows. The key is definitely the baseline measurement though. Hard to prove ROI otherwise.