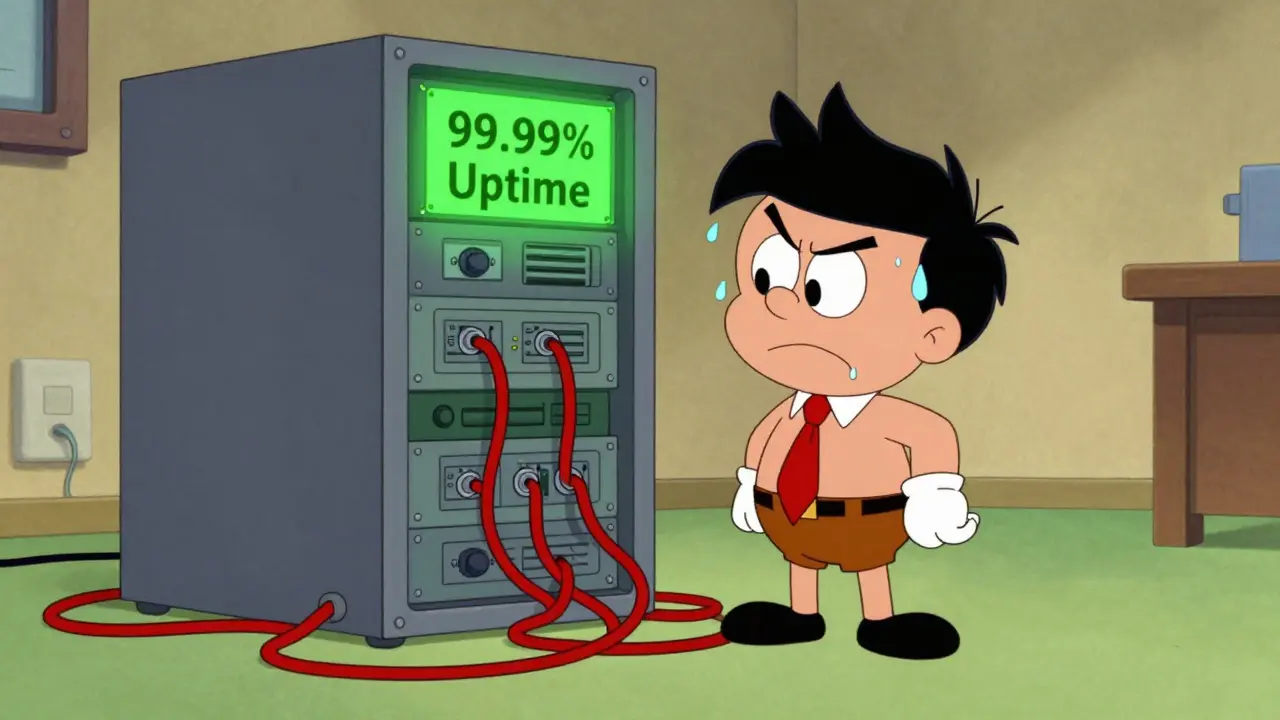
Most teams obsess over uptime. They chase that elusive 99.99% availability target, treating it like a holy grail. But here is the uncomfortable truth: you can have perfect uptime today and still be doomed tomorrow if your codebase becomes impossible to change. This is where Maintainability SLOs come in. They are not just another metric to track; they are the bridge between how fast you build and how long your system survives.
Traditional Service Level Objectives (SLOs) focus on what the user sees right now-latency, errors, availability. Maintainability SLOs focus on what the engineer experiences when trying to fix or improve that system. If your developers spend more time fighting technical debt than building features, your maintainability SLOs are failing, even if your servers are green. In this guide, we will break down exactly which indicators matter, how to set realistic targets, and how to configure alerts that actually help rather than annoy.
Why Maintainability SLOs Matter More Than You Think
Let’s get one thing straight: reliability is not static. It decays. Every line of code added without proper testing, every quick hack deployed to meet a deadline, and every ignored refactor adds weight to your system. Eventually, that weight slows you down. Charity Majors, CTO of Honeycomb, put it bluntly in her 2024 keynote: "Maintainability SLOs are the missing link between engineering velocity and system reliability." Without them, you are optimizing for today’s uptime at the expense of tomorrow’s stability.
The data backs this up. According to Sedai’s 2023 analysis of 1,200 engineering teams, organizations with formal maintainability SLOs resolved incidents 47% faster than those without. Why? Because they had measurable standards for how clean and responsive their code should be. When things broke, they knew exactly where to look and how quickly they needed to act. Meanwhile, Vivantio’s 2024 study found that tracking feature lead time as a Service Level Indicator (SLI) correlated with a 28% increase in customer satisfaction. Faster, cleaner changes mean happier users.
But there is a catch. Implementing these metrics is harder than setting an uptime alert. Atlassian’s 2023 comparative analysis showed that while maintainability SLOs improve feature delivery speed by 35%, they require 40% more initial configuration effort. You cannot just slap a sensor on a server. You need to connect your CI/CD pipelines, version control systems, and incident management tools. It is complex, but the payoff is a team that stops burning out from constant firefighting.
Key Indicators for Measuring Maintainability
You cannot manage what you do not measure. But which numbers actually tell you if your software is easy to maintain? The Google SRE book emphasizes that effective SLIs must be quantifiable, user-impacting, and actionable. For maintainability, that means moving beyond vanity metrics like "lines of code changed" and focusing on outcomes.
| Indicator | Definition | Recommended Target | Why It Matters |
|---|---|---|---|
| Mean Time to Recovery (MTTR) | Average time to restore service after a failure | < 1 hour | Measures how easily you can fix issues without deep debugging |
| Pull Request Cycle Time | Time from PR creation to merge | < 24 hours | Indicates review bottlenecks and code complexity |
| Change Failure Rate | % of deployments causing failures | < 5% | Reflects test coverage and deployment safety |
| Technical Debt Ratio | Cost to fix defects vs. cost of new development | < 5% | Tracks accumulation of shortcuts and hacks |
| Deployment Frequency | Number of successful releases per period | Multiple times/day (Elite) | Shows confidence in automation and modularity |
Notice that none of these are about server CPU usage. They are about human workflow. AWS CloudWatch’s 2024 SLO implementation guide supports these metrics through custom SLI configurations. For example, you might define a threshold for deployment frequency, such as a minimum of 15 deployments per week, or a rollback success rate of 99%. These numbers force you to ask: "Is our system designed to be changed safely?"
A common mistake is tracking too many metrics at once. Gartner’s 2024 SRE market guide warns that 71% of failed SLO implementations occur when teams try to implement maintainability metrics before stabilizing core reliability indicators. Start small. AWS recommends beginning with no more than three maintainability SLIs. Deployment frequency, change failure rate, and MTTR are solid starting points because they directly impact both developer happiness and user experience.

Setting Realistic Targets and Error Budgets
Here is where most teams stumble. Availability SLOs have clear industry benchmarks: 99.9% uptime is standard. Maintainability SLOs do not. The DORA State of DevOps Report 2023 highlights this disparity: elite performers deploy multiple times per day, while low performers may deploy monthly. Comparing yourself to a generic benchmark is useless. You need context-specific targets.
This is why error budgets work differently for maintainability. Unlike availability, where an error budget might be calculated over a quarter, maintainability SLOs often use shorter measurement windows of 7 to 14 days. Splunk’s 2024 SLO implementation guide notes that rapid feedback is crucial for development processes. If your pull request cycle time spikes, you want to know next week, not next quarter.
Calibrating these budgets requires historical data. One engineering director shared in a June 2024 case study that their team determined an acceptable error budget of 15% for "changes requiring follow-up fixes" only after analyzing six months of historical data. They didn’t guess. They looked at what was sustainable. Dr. Nicole Forsgren argues in IEEE Software that maintainability SLOs must be balanced with operational SLOs. Teams that optimize solely for deployment frequency without corresponding reliability metrics see a 32% higher incident rate during business hours. Your target should reflect a balance between speed and safety.
Configuring Alerts That Don’t Drive You Crazy
Alerts are tricky. Too few, and you miss problems. Too many, and you ignore them all. For maintainability SLOs, the goal is to alert on symptoms, not causes. Nobl9’s 2024 implementation guide details that 73% of successful programs start with symptom-based alerts. Instead of alerting on "high cyclomatic complexity in code changes," alert on "increased rollback frequency." The former is a code quality issue; the latter is a business impact issue.
Multi-window burn rate alerts are essential here. Splunk reports that 68% of organizations using maintainability SLOs configure multi-window alerts. Use a 6-hour window for critical issues, like a sudden spike in change failure rates, and a 72-hour window for gradual degradation, like slowly increasing pull request cycle times. This prevents alert fatigue while ensuring you catch slow leaks.
Also, consider cooldown periods. The Google SRE subreddit community frequently suggests implementing cooldown periods of 24 to 72 hours for maintainability alerts. This prevents noise during planned maintenance windows or major refactoring efforts. If you are intentionally breaking things to rebuild them, you don’t want your SLO dashboard screaming at you.
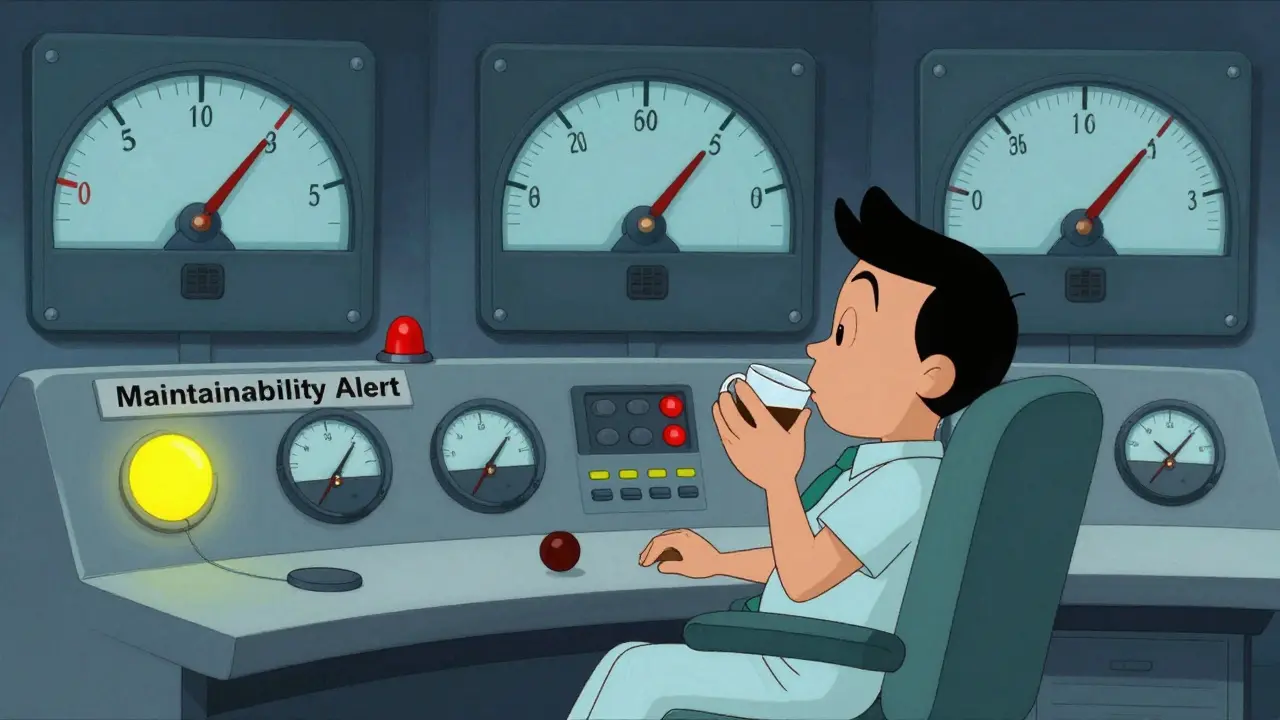
Common Pitfalls and How to Avoid Them
Even with good intentions, maintainability SLOs can backfire. A Hacker News post in February 2024 titled "Why we abandoned our maintainability SLOs" documented a mid-sized SaaS company that saw a 22% increase in production incidents after implementing strict pull request cycle time targets. The pressure to merge code quickly led to premature merges and sloppy reviews. The metric was right, but the culture wasn’t ready.
Another major pitfall is misalignment between engineering and business priorities. Capterra reviews highlight that 68% of negative feedback about maintainability SLOs centers on this disconnect. One product manager noted that their team hit all maintainability SLOs but missed customer delivery dates because they optimized for cycle time over feature completeness. Always tie your maintainability metrics to business outcomes. If faster cycles don’t lead to better customer acquisition or retention, you are just running faster in the wrong direction.
Data siloing is also a significant barrier. Acceldata’s 2023 research found that 61% of engineering teams struggle to connect code quality metrics with operational performance data. To avoid this, integrate your tools early. Connect your GitHub or GitLab data with your monitoring platform like Datadog or New Relic. If your data lives in separate places, your SLOs will be incomplete.
Implementation Roadmap: From Zero to Hero
Ready to start? Follow this four-phase approach based on Vivantio’s 2024 framework:
- Initial Setup (2-4 weeks): Define your initial metrics. Pick three SLIs from the table above. Get buy-in from engineering leads and product managers.
- Monitoring Integration (4-8 weeks): Connect your data sources. Ensure your CI/CD pipeline logs are flowing into your observability tool. Validate data accuracy.
- Operational Integration (8-12 weeks): Establish alerting rules. Configure multi-window burn rates and cooldown periods. Test alerts in non-production environments.
- Continuous Refinement (Ongoing): Review SLO performance monthly. Adjust targets based on actual capacity. Expand to additional metrics as maturity grows.
Remember, this is a journey. Gartner predicts that by 2026, 75% of organizations will implement at least one business-outcome-focused maintainability SLO. You don’t need to be perfect on day one. You just need to start measuring.
What is the difference between availability SLOs and maintainability SLOs?
Availability SLOs measure if the system is up and responding correctly for users (e.g., 99.9% uptime). Maintainability SLOs measure how easy it is for engineers to modify, update, and fix the system over time (e.g., mean time to recovery under 1 hour). One focuses on the present state; the other focuses on future adaptability.
How do I calculate my maintainability error budget?
Unlike availability, there is no universal standard. Start by analyzing 3-6 months of historical data for metrics like change failure rate or pull request cycle time. Determine what percentage of failures or delays your team can handle without burning out. For example, if 10% of your deployments typically require hotfixes, you might set an error budget of 15% to allow room for improvement while acknowledging current reality.
Which tools support maintainability SLOs?
Dedicated SLO platforms like Nobl9, Blameless, and Sedai offer robust support for custom maintainability metrics. Traditional monitoring tools like AWS CloudWatch, Datadog, and Splunk also support these SLOs through custom SLI configurations, though they may require more manual integration with CI/CD pipelines and version control systems.
Can maintainability SLOs hurt developer morale?
Yes, if implemented poorly. Strict targets on metrics like pull request cycle time can pressure engineers to skip thorough reviews, leading to more bugs and frustration. To prevent this, ensure targets are realistic, based on historical data, and aligned with business goals rather than arbitrary speed demands. Focus on outcome-based metrics like change failure rate rather than just speed.
When should I start implementing maintainability SLOs?
Gartner recommends implementing maintainability SLOs only after establishing foundational operational SLOs like availability and latency. If your system is unstable, fixing maintainability won’t help. Once your core reliability is steady, introduce maintainability metrics to ensure that stability can be sustained as the system evolves.

The existential dread of the modern engineer is not that the server will crash, but that the code they wrote three years ago has become an alien artifact, incomprehensible even to its creator. We chase uptime like it is a god, sacrificing our souls on the altar of availability, only to find ourselves trapped in a labyrinth of our own making. This article speaks truth to power, exposing the hollow victory of green dashboards while the foundation rots beneath us. It is a philosophical crisis disguised as a technical problem.
hey there! i totally agree with what you are saying here and it really resonates with me because i have seen so many teams struggle with this exact issue over the years where they focus too much on keeping things running instead of keeping them clean which leads to a lot of pain later on down the line when someone tries to make a simple change and ends up breaking everything else in the process so yeah we need to start caring more about maintainability from day one rather than treating it as an afterthought or something we can fix later because trust me it never gets fixed later it just gets worse and worse until the whole thing collapses under its own weight
Another fluffy piece of corporate fluff trying to quantify the unquantifiable. You think tracking PR cycle time magically fixes bad architecture? Please. Most of these 'SLOs' are just management KPIs dressed up in fancy language to make engineers feel productive while they burn out. I've seen teams hit every single metric in that table and still deliver garbage software because the metrics measure activity, not quality. Stop pretending data solves culture problems.
I appreciate the nuance here. The distinction between availability SLOs and maintainability SLOs is crucial for long-term health. In my experience, the biggest hurdle isn't the tooling-it's the cultural shift required to accept that slowing down now speeds you up later. The section on error budgets being shorter (7-14 days) is particularly insightful. It forces immediate feedback loops that traditional quarterly reviews miss entirely. Great read.
This is absolutely fantastic!! I cannot believe how often I see teams ignoring this aspect of development!!! The part about alerts driving you crazy is so true!!! We had a similar situation where we got pinged every time complexity went up by 1%!!! It was insane!!! Thank you for sharing this roadmap!!! It really helps to have a structured approach!!!
metrics are just shadows cast by the substance of the work. if the substance is rotten the shadow will be distorted no matter how precisely you measure it. we build systems to serve human needs yet we treat them as abstract mathematical constructs. perhaps the real SLO is empathy for the next developer who touches your code.
interesting read but frankly most of this is obvious to anyone who has actually built scalable systems in the us. european teams tend to overcomplicate simple engineering concepts with unnecessary bureaucracy. just write clean code and test it properly. you dont need a dashboard for that. stop wasting time on vanity metrics and focus on delivering value to customers who actually pay for the product.
lol another day another article telling us to do the bare minimum of actual engineering. i mean sure tracking MTTR is cool if you have time to sit around watching graphs instead of shipping features. but lets be real most startups dont care about maintainability until they are dying. then they hire some expensive consultant to tell them what they already knew. typical tech bro nonsense.
I wonder if the pressure to implement these quickly contributes to the failure rates mentioned. It seems like a delicate balance between measuring enough to improve without measuring so much that it becomes a burden. Curious how smaller teams handle the initial configuration effort compared to larger enterprises.
The silence of a stable system is deceptive. It masks the accumulating entropy within the codebase. We must listen to the whispers of technical debt before they become screams of production failures. A measured pace is not slowness; it is wisdom.