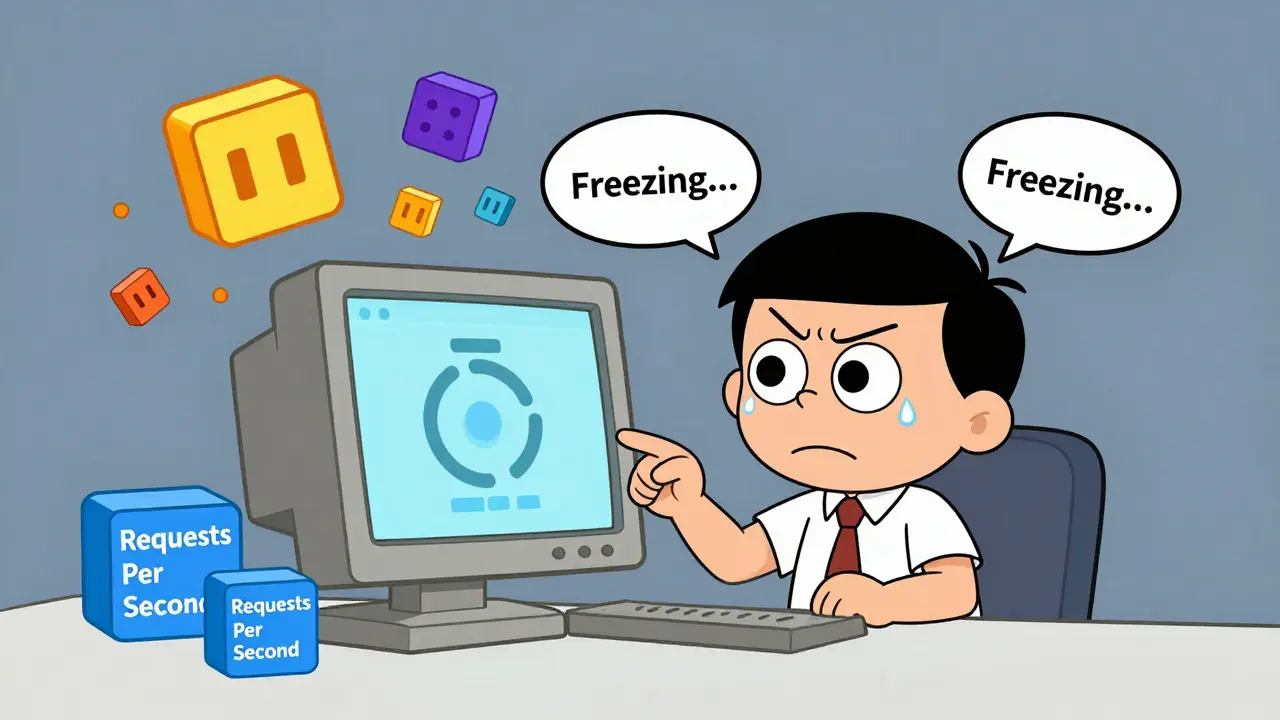
You know that feeling when a chatbot freezes right after you hit send? It’s not just annoying; it’s expensive. As we move deeper into 2026, deploying Large Language Models (LLMs) in production is no longer just about picking the smartest model. It’s about managing the chaotic reality of inference infrastructure. If you are running LLMs at scale, traditional monitoring tools are lying to you. They show you averages, but your users live in the tails.
Real observability for LLM inference means looking past simple uptime checks. You need to understand token throughput, queue dynamics, and the specific latency spikes that kill user experience. This isn't optional overhead anymore. It is the difference between a scalable service and one that collapses under its own weight.
The Problem with "Requests Per Second" in LLM Systems
If you are used to monitoring standard web APIs, you probably rely heavily on requests per second (RPS). That metric is useless for LLMs. Why? Because LLM workloads are wildly variable. One request might ask for a simple "yes or no" answer, consuming ten tokens. Another might demand a 2,000-word essay. Both count as one request in your dashboard, but they consume vastly different amounts of compute power and memory bandwidth.
When you track only RPS, you can see stable traffic while your actual token throughput collapses. This disconnect hides bottlenecks until they become critical failures. Instead of RPS, you need to shift your focus to token metrics. These metrics reveal the true load on your system.
Core token metrics include:
- Prompt Tokens: The input data sent to the model. Tracking this helps you understand context window usage and prefill costs.
- Completion Tokens: The output generated by the model. This is where the heavy computation happens during autoregressive generation.
- Total Token Consumption: Aggregated by model, user, or feature to calculate accurate cost per interaction.
Tools like Text Generation Inference (TGI) and vLLM export these metrics explicitly. Look for counters like `tgi_request_generated_tokens` or histograms tracking `gen_ai.client.token.usage`. By aggregating these, you stop guessing why your GPU utilization spiked and start knowing exactly which prompts caused it.
Decoding Latency: TTFT vs. Inter-Token Latency
Latency in LLM systems isn't a single number. It breaks down into two distinct experiences for the user: waiting for the first word, and watching the rest stream in. Confusing these two leads to poor optimization strategies.
Time-to-First-Token (TTFT)
Time-to-First-Token (TTFT) is the initial delay before any text appears on the screen. This is the "is it working?" moment for users. Research shows that for every additional input token, the P95 TTFT increases by approximately 0.24 milliseconds. While that sounds small, long contexts amplify this delay significantly.
In practice, sub-50ms TTFT feels instantaneous. Anything above 200ms starts to feel sluggish. If your TTFT jumps to several seconds, users assume the application has frozen. Monitoring TTFT requires histogram-type metrics, such as `vllm:time_to_first_token_seconds`. A sudden rise in TTFT is often the first sign that your inference engine is saturated or that your batch size is too large for the current hardware constraints.
Inter-Token Latency
Once the first token arrives, the user cares about the flow. Inter-token latency measures the time between subsequent tokens. If this latency rises, the response feels fragmented or stuttering, even if the total completion time is acceptable. This metric directly impacts perceived responsiveness. Track this using metrics like `tgi_request_mean_time_per_token_duration`. High inter-token latency usually indicates memory bandwidth bottlenecks or inefficient scheduling within the inference engine.

Queueing Dynamics: The Hidden Bottleneck
Most modern LLM deployments use continuous batching to maximize GPU utilization. This creates a queue. Understanding this queue is critical because LLM inference follows an M/G/1 queueing model, where the variability of service times (output length) drastically affects wait times.
Here is the trap: a few requests asking for very long outputs create a "heavy tail" in the distribution. These long requests hold up the entire batch, extending the average queuing delay for everyone else. According to recent queueing theory analysis, this can cause a significant percentage of impatient users to abandon the platform before their request is even processed.
To manage this, you must monitor queue-specific metrics:
- Queue Wait Time: Reveals delays caused by waiting for an available replica or slot in the batch.
- Active Queue Size: Shows how many requests are pending execution.
- Batch Size: Indicates how many requests are being processed simultaneously.
Both TGI and vLLM expose these indicators. If you see queue wait times climbing while GPU utilization remains high, you have a scheduling inefficiency. You aren't lacking compute; you're lacking efficient packing.
| Metric Name | Type | What It Tells You | Common Source |
|---|---|---|---|
| TTFT | Histogram | Initial user wait time; saturation indicator | vLLM, TGI |
| Inter-Token Latency | Histogram | Streaming smoothness; memory bandwidth pressure | TGI, OpenTelemetry |
| Token Throughput | Gauge/Counter | Actual computational load vs. RPS | vLLM, TGI |
| Queue Depth | Gauge | Pending requests; risk of abandonment | TGI, vLLM |
| P99 End-to-End Latency | Histogram | Worst-case user experience | OpenTelemetry, Prometheus |
Taming Tail Latency with Token Limits
Average latency is a vanity metric. Nobody cares about your average if the 99th percentile (P99) is terrible. Tail latency defines the actual user experience for the most frustrated segment of your audience. In LLM systems, tail latency is driven by the heavy-tailed distribution of output lengths. Some users want a summary; others want a novel chapter. The latter drags down performance for everyone.
Research suggests a counter-intuitive solution: enforcing maximum output token limits. By capping the output length for a small fraction of requests, you can significantly reduce overall queuing delay. The trade-off is quality versus speed. If the limit is too low, you truncate useful responses. If it's too high, you accept longer waits.
Your observability system must provide the data to make this trade-off intelligently. You need to correlate token distribution histograms with queue depth and drop rates. If you notice that requests exceeding 2,000 tokens cause queue depths to spike beyond a certain threshold, you might implement dynamic routing. Short requests go to a low-latency pool; long requests go to a best-effort pool with higher timeout allowances.
Implementing Observability: Tools and Standards
You don't need to build this from scratch. The ecosystem has matured significantly. Standardization is key to avoiding vendor lock-in and ensuring consistent data collection across different models and frameworks.
Adopt OpenTelemetry semantic conventions for GenAI. These conventions provide standardized metric names like `gen_ai.server.time_to_first_token` and `gen_ai.server.time_per_output_token`. Using these standards ensures that whether you switch from vLLM to TGI or integrate a new proprietary model, your dashboards remain relevant.
For aggregation and alerting, pair these exporters with Prometheus and Grafana. Set up alerts based on percentiles, not averages. For example, alert if P95 TTFT exceeds 500ms for more than five minutes. Also, monitor cost anomalies. Different models have vastly different cost profiles. An unexpected spike in token consumption could indicate a prompt injection attack or a runaway recursive loop in your application logic.
Finally, integrate business-level metrics. Track success rates (`vllm:request_success_total`) alongside technical metrics. A high error rate combined with low latency might mean your model is rejecting inputs rather than processing them slowly. Context matters.
Next Steps for Your Infrastructure
Start by auditing your current metrics. If you are only tracking HTTP status codes and request counts, you are flying blind. Instrument your inference servers to export token-level and latency-percentile data. Map out your queue behavior under load. Identify the heavy tails in your output distribution. Then, decide where to draw the line between speed and completeness. Observability isn't just about watching; it's about giving you the leverage to optimize.
Why is Requests Per Second (RPS) a bad metric for LLMs?
RPS fails because LLM workloads are highly variable. A short query and a long essay both count as one request, but they consume vastly different resources. Tracking token throughput instead reveals the true computational load and prevents hidden bottlenecks.
What is the ideal Time-to-First-Token (TTFT)?
Sub-50ms TTFT feels instantaneous to users. Delays above 200ms start to feel sluggish, and anything over several seconds causes users to assume the app is frozen. TTFT is primarily affected by input token count and system saturation.
How do queueing dynamics affect LLM performance?
LLM inference uses continuous batching, creating queues. Long output requests create a "heavy tail" that blocks shorter requests, increasing wait times for all users. Monitoring queue depth and wait times helps identify scheduling inefficiencies.
Should I set maximum output token limits?
Yes, strategically. Capping output tokens for a subset of requests can significantly reduce queueing delay and tail latency. Use observability data to find the balance between response quality and user wait times.
Which tools should I use for LLM observability?
Use inference engines like vLLM or TGI that export detailed metrics. Standardize on OpenTelemetry semantic conventions for GenAI. Aggregate data with Prometheus and visualize it in Grafana. Focus on histogram metrics for latency percentiles.

It is frankly astonishing how many Western tech blogs still struggle to grasp the fundamental principles of queueing theory in distributed systems, a discipline where Indian engineers have been leading the charge for decades. Your exposition on the inadequacy of Requests Per Second (RPS) as a primary metric for Large Language Model inference is technically accurate, yet it feels like stating that water is wet to someone who has never seen an ocean. The distinction between Time-to-First-Token (TTFT) and Inter-Token Latency is not merely a nuance; it is the cornerstone of user experience optimization in autoregressive generation pipelines. I must commend your precise utilization of OpenTelemetry semantic conventions, which aligns perfectly with the rigorous standards we uphold in our high-frequency trading and AI infrastructure divisions here in Bangalore. However, one cannot help but notice the slight omission regarding the specific hardware constraints of H100 versus A100 clusters when discussing memory bandwidth bottlenecks. It is imperative that practitioners understand that while vLLM and TGI provide excellent observability hooks, the underlying CUDA kernel efficiency remains the true determinant of tail latency performance. Do not mistake this critique for hostility; rather, consider it a necessary correction from those who actually build the backbone of global AI infrastructure.
oh look another blog post pretending to be smart about gpu queues
i bet you guys are using some fancy dashboard that costs more than my car just to watch numbers go up and down
the real problem isnt the metrics its the fact that nobody knows how to write efficient code anymore everyone just slaps together python scripts and wonders why their latency sucks
you talk about heavy tails like its some new discovery but any sysadmin worth their salt knew about long requests blocking short ones back when we were running apache servers in basements
and dont get me started on this token limit nonsense
if users want a novel chapter they should pay for a novel chapter not get truncated by some arbitrary cap decided by a product manager who has never touched a terminal
your solution is basically putting a speed bump on the highway because people drive too fast instead of fixing the road
typical corporate tech speak designed to sell consulting hours
I completely understand the frustration that can arise when dealing with complex infrastructure challenges, especially when traditional monitoring tools fail to provide the clarity needed for effective decision-making, and it is truly heartening to see such a detailed exploration of these issues being shared openly within our community so that everyone can benefit from the collective wisdom and experience of those who have navigated similar obstacles before us. The emphasis on empathizing with the end-user experience through metrics like Time-to-First-Token resonates deeply with my own professional journey, where I have witnessed firsthand how even minor delays can create significant barriers to accessibility and engagement for individuals who rely on these technologies for critical daily tasks, thereby highlighting the importance of inclusive design principles that prioritize human-centric outcomes over mere computational efficiency. Furthermore, the discussion surrounding queue dynamics and the potential for request abandonment serves as a poignant reminder of the ethical responsibilities we bear as technologists to ensure that our systems do not inadvertently marginalize users who may be less patient or technically savvy, thus encouraging us to adopt more thoughtful and compassionate approaches to system architecture that value every single interaction as an opportunity to foster trust and reliability. By shifting our focus from vanity metrics like average latency to more nuanced indicators such as P99 tail latency and token throughput, we empower ourselves to make informed decisions that not only optimize performance but also enhance the overall well-being of our digital communities, creating a more equitable and supportive environment for all participants regardless of their technical background or resource availability. It is essential that we continue to engage in these meaningful dialogues and share our insights generously, as doing so allows us to learn from one another's diverse perspectives and experiences, ultimately strengthening our collective ability to address the multifaceted challenges posed by emerging technologies in ways that are both innovative and socially responsible. Let us remember that behind every data point and metric lies a real person seeking connection and assistance, and our commitment to observability should always be guided by a genuine desire to improve their lives and reduce unnecessary friction in their interactions with our platforms.
Ah, yes, the classic tale of the GPU queue, where everyone waits patiently while one person asks the AI to write their entire thesis.
In Cape Town, we call this 'load shedding' for brains.
You suggest capping tokens? Bold move. Next you'll tell me I should ration my wifi during peak hours.
But seriously, if your system collapses because someone wanted a long answer, maybe fix the system, not the user.
The moral decay of modern engineering is laid bare in this obsession with efficiency over substance
We have become a society that values the speed of delivery more than the quality of thought itself
hey there mate i think this is a really interesting take on the whole observability thing and i totally agree that we need to stop looking at just rps because as you said its kinda useless when you have variable output lengths which is pretty much everything in llm land these days. i was reading through the section on ttft and inter-token latency and it made me think about how much time we spend debugging things that we cant even see properly because our dashboards are showing averages which is like trying to describe a storm by saying it rained a bit. i work with a team that uses vllm and weve been struggling with queue depths spiking randomly and it turns out it was just a few users asking for massive code generations which held up the batch for everyone else so implementing some kind of dynamic routing or token limits might actually be the way to go even if it feels a bit restrictive at first. also the part about open telemetry conventions is spot on because switching between different inference engines without standardized metrics is a nightmare and causes so much confusion in the team meetings. i know im not the most articulate guy when it comes to writing these long comments but i really appreciate posts like this that break down the technical stuff in a way that makes sense for people who are just trying to keep their services running smoothly without burning cash on gpus that are sitting idle half the time. thanks for sharing this info it definitely gave me some ideas on what to tweak in our monitoring setup next week hopefully it helps others too who are stuck in the same boat trying to figure out why their p99 latency is exploding for no apparent reason.