Training a large language model (LLM) isn't just about buying GPUs; it's a massive logistical operation that burns through electricity at an industrial scale. If you're managing an AI team or evaluating the true cost of deploying these models, you need to look beyond the sticker price of hardware. You need to understand the energy and cost accounting behind every token generated during training.
The gap between what we think we spend and what we actually consume is widening. Early estimates often ignored the "hidden" energy used in failed experiments, cooling systems, and data preprocessing. Today, accurate accounting is critical for budgeting, regulatory compliance, and simply making sense of your cloud bills. This guide breaks down how to measure, calculate, and optimize the energy footprint of your LLM training pipelines.
Why Energy Accounting Matters More Than Ever
Let’s start with the numbers that have shaken the industry. When OpenAI trained GPT-3, a 175-billion parameter model, the primary run consumed approximately 1,287 MWh of electricity. That sounds like a lot, but the context matters. It equates to over 552 metric tons of CO2-equivalent emissions if powered by the average US grid mix. To put that in perspective, that’s roughly the lifetime emissions of five average American cars.
But GPT-3 was just the beginning. Recent systematic reviews suggest that GPT-4 required more than 40 times the electricity of its predecessor. While exact figures are proprietary, scaling from the GPT-3 baseline implies a training demand exceeding 51,000 MWh. For comparison, Meta’s Llama 3 family required slightly above 500,000 kWh (or 500 MWh). These aren't just academic footnotes; they represent real financial liabilities and environmental impacts that affect brand reputation and operational sustainability.
The problem? Many published estimates still omit key overheads. If you only count the GPU power draw, you’re missing 10% to 60% of the total energy bill. Accurate accounting requires looking at the whole system, not just the compute nodes.
Deconstructing the Total Energy Budget
To get an accurate picture, you must decompose total electricity use into specific components. Think of it as an audit of your entire datacenter stack, not just the servers.
- Compute Power: The direct energy consumed by GPUs or TPUs. This is usually the largest single line item.
- Memory and Storage: RAM, SSDs, and high-speed interconnects that keep data flowing to accelerators.
- Networking: Data transfer between nodes, which becomes significant in distributed training clusters.
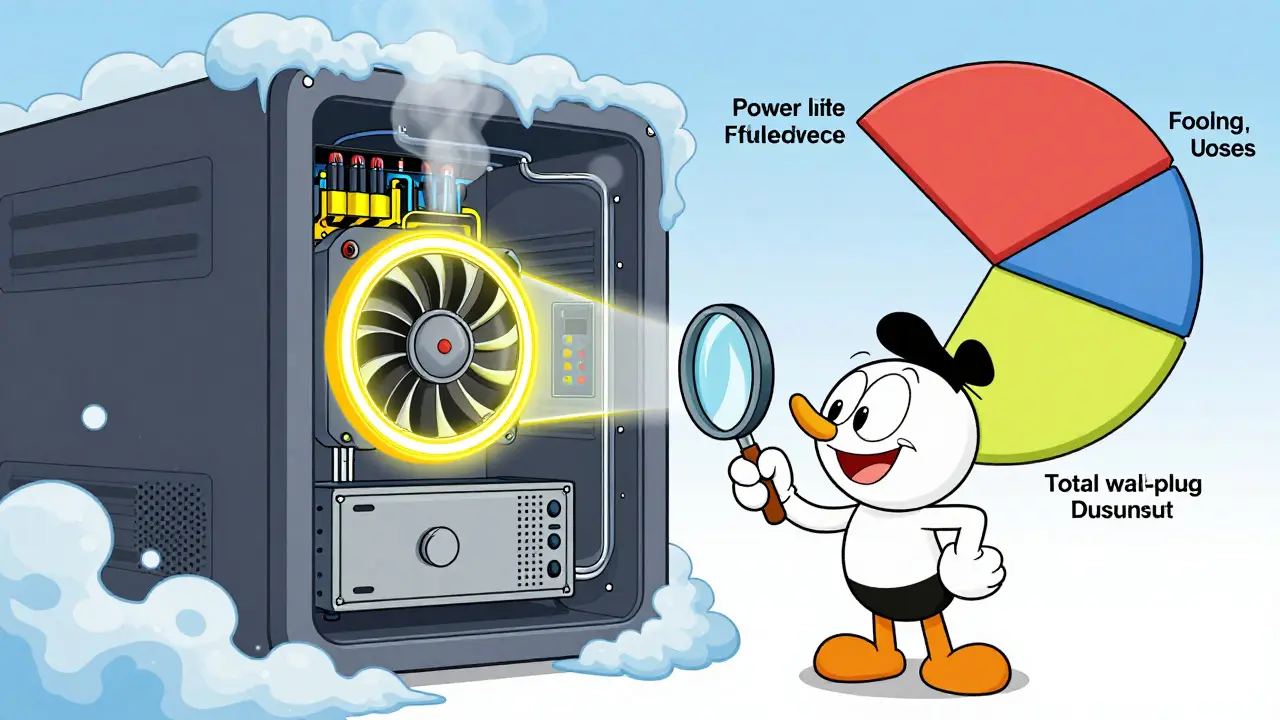
- Non-IT Overhead (PUE): Cooling, lighting, and power distribution losses. This is measured by the Power Usage Effectiveness (PUE) ratio.
PUE is where many budgets go wrong. A PUE of 1.0 means perfect efficiency (all power goes to IT equipment). Most modern datacenters operate between 1.1 and 1.6. If your PUE is 1.5, you’re using 50% more electricity than the raw compute load suggests. Always multiply your calculated compute energy by your facility's PUE to get the true wall-plug consumption.
Methodologies: Bottom-Up vs. Top-Down
There are two main ways to estimate this energy usage, and choosing the right one depends on your stage of development and available tools.
Top-Down Estimation (FLOPs-Based)
This is the older, faster method. You estimate the total number of floating-point operations (FLOPs) required for a training run based on model size, dataset size, and number of epochs. Then, you apply an average "Joules-per-FLOP" factor derived from hardware datasheets.
Pros: Quick to calculate before training starts. Good for high-level budgeting. Cons: Can be inaccurate because it assumes constant efficiency. It often misses the energy cost of hyperparameter search and failed runs.
Bottom-Up Measurement (Telemetry-Based)
This is the gold standard for precision. You instrument your training pipeline with power sensors on individual GPUs, logging instantaneous power draw at fine time resolution. Tools like NVIDIA DCGM or cloud provider metrics allow you to capture utilization and power states in real-time.
Pros: Captures actual behavior, including idle times, thermal throttling, and network waits. Cons: Requires setup effort and continuous monitoring infrastructure.
For serious cost accounting, bottom-up is non-negotiable. Why? Because the majority of compute cost in complex projects often arises from experimentation, not the final model. A study from UMass Amherst found that the most energy-intensive configurations were often part of hyperparameter tuning, not the final deployed model. If you don’t meter those failed attempts, you’re underestimating your true cost by a factor of several.
From Kilowatt-Hours to Dollars and Carbon
Once you have your total energy in kilowatt-hours (kWh), you can translate that into monetary cost and carbon emissions.
Monetary Cost Calculation
Cost = Total kWh × Local Electricity Tariff ($/kWh). However, in cloud environments, you’re often paying for reserved instances or spot pricing rather than raw electricity. In that case, your "cost" is the cloud invoice, but understanding the underlying energy helps you negotiate better rates or predict future bill spikes. For on-premises setups, the electricity tariff is direct. Keep in mind that even post-training inference has a huge cost; running ChatGPT-3.5 has been estimated to cost around $700,000 per day purely in energy at scale.
Carbon Emission Calculation
Emissions (kg CO2e) = Total kWh × Grid Carbon Intensity (kg CO2e/kWh) × PUE. Grid carbon intensity varies wildly by location. A datacenter in Oregon (hydro-heavy) might emit 0.1 kg CO2e/kWh, while one in a coal-heavy region might emit 0.7 kg CO2e/kWh. This seven-fold difference means your choice of cloud region directly impacts your sustainability report. Always document the specific grid mix assumption you use for transparency.
| Model | Estimated Training Energy (MWh) | CO2e Emissions (Metric Tons) | Key Context |
|---|---|---|---|
| GPT-3 | ~1,287 | >552 | Baseline for frontier model comparisons |
| Llama 3 Family | >500 | Varies by grid | Open-weight, comparable performance to GPT-3 |
| GPT-4 | >51,000 (Est.) | Tens of thousands | Proprietary, >40x GPT-3 energy demand |
| Transformer (2019 Exp.) | ~656 | ~626 | Included extensive hyperparameter search |

Best Practices for Reducing Training Costs
You don’t have to accept high energy bills as inevitable. Several proven strategies can slash both cost and carbon footprint without sacrificing model quality.
- Leverage Transfer Learning: Don’t train from scratch if you don’t have to. Fine-tuning a pre-trained base model uses a fraction of the energy of full pre-training.
- Use Model Compression: Techniques like distillation (training a smaller student model from a larger teacher), pruning, and quantization reduce computation. Experimental settings show these methods can improve energy efficiency by 2x to over 10x.
- Schedule for Low-Carbon Windows: If you control your own infrastructure, schedule heavy training jobs when renewable energy penetration is highest in your grid.
- Optimize Hardware Selection: Newer GPUs and TPUs offer significantly better FLOPs-per-watt. Upgrading hardware can reduce energy per step dramatically.
- Track Failed Runs: Implement automated stopping criteria for hyperparameter searches to prevent wasting energy on doomed configurations.
Consider the work done by UC Santa Cruz researchers who demonstrated that a billion-parameter model could run on custom hardware at just 13 watts-roughly the power of a lightbulb-compared to ~700 watts on standard GPUs. While that’s extreme co-design, it highlights the potential for algorithm-hardware synergy to bend the curve of energy demand.
Implementing Your Own Accounting Framework
If you want to start tracking this today, here is a practical checklist:
- Instrument Everything: Enable power monitoring on all accelerators. Log duration, configuration, and power draw for every job.
- Define Your Baseline: Decide if you’re reporting "compute-only" or "total facility" energy. Be consistent.
- Document Assumptions: Record your PUE value and grid carbon intensity source. This allows others to reproduce or adjust your numbers.
- Include Experimentation: Count the energy used for data preprocessing, architecture search, and evaluation steps. These are part of the production pipeline.
- Review Monthly: Compare actual spend against forecasts. Look for anomalies that indicate inefficiency.
Standardized reporting is becoming a norm. Major tech companies are increasingly expected to disclose energy and emissions figures for major training runs. By getting ahead of this, you turn a compliance burden into a competitive advantage, demonstrating responsible AI stewardship.
What is the average energy cost of training a mid-sized LLM?
It varies widely, but open-weight models like Llama 3 required over 500 MWh. Smaller specialized models might require tens of MWh. The key variable is whether you include hyperparameter search and data preprocessing in the total.
How does PUE affect my energy bill?
PUE (Power Usage Effectiveness) accounts for cooling and overhead. A PUE of 1.5 means you pay for 1.5 units of electricity for every 1 unit used by servers. Ignoring PUE underreports your true energy consumption by up to 50%.
Is it cheaper to train on-premise or in the cloud?
For short-term or experimental workloads, cloud is often easier to manage. For long-term, high-volume training, on-premise can be cheaper due to lower marginal electricity costs, but requires higher upfront capital expenditure and expertise in energy management.
Do I need to account for inference energy?
Yes, especially for consumer-facing apps. While training is a one-time (or periodic) cost, inference is ongoing. At scale, daily inference costs can exceed training costs, making it a critical part of total lifecycle accounting.
How can I reduce the carbon footprint of my AI models?
Choose cloud regions with low-carbon grids, use efficient algorithms like quantization and pruning, leverage pre-trained models instead of training from scratch, and ensure your datacenter has a low PUE.