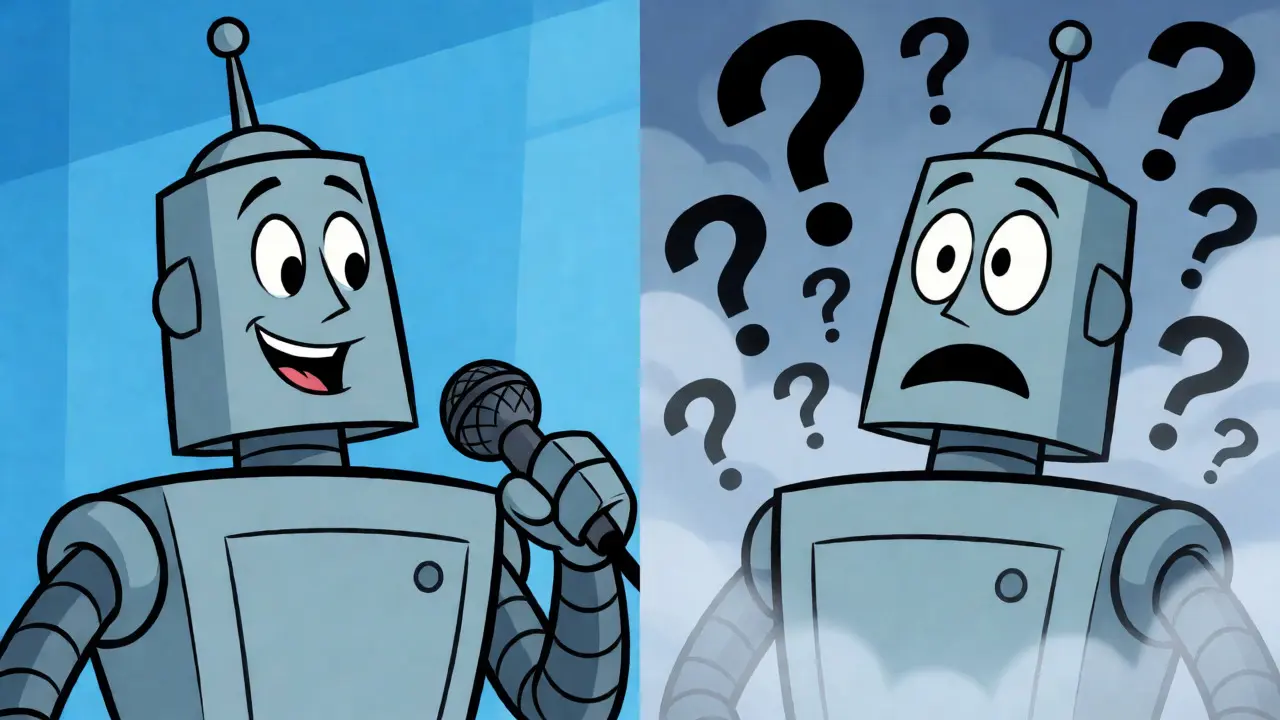
You ask an AI a question, and it answers with the same smooth, authoritative tone whether it’s reciting the periodic table or inventing a court case that never happened. This is the core problem with modern generative models: they are designed to sound confident, even when they are wrong. For users relying on these systems for critical decisions in healthcare, finance, or engineering, this "confident hallucination" creates a dangerous blind spot. The system’s confidence becomes our confidence, masking the underlying uncertainty until it’s too late.
Generative AI is a type of artificial intelligence that creates new content by learning patterns from vast datasets, often producing outputs without explicit indicators of reliability. Unlike traditional statistical tools that provide clear error bars or confidence intervals, most large language models (LLMs) today output text as if every word is fact. This disconnect between internal probability and external presentation is what researchers call the uncertainty communication gap.
The Psychology of Overconfidence
Why does this matter? Because humans are wired to trust fluency. When an AI response is grammatically perfect and logically structured, we assume it’s correct. A study published in Frontiers in Computer Science in early 2025 found that participants with negative attitudes toward AI actually trusted the system more when uncertainty was visualized, but only if the visualization matched their expectations. Without those cues, over-reliance spikes. In fact, research from the Center for Engaged Learning showed that 68.4% of students reported reduced critical thinking when using standard AI tools compared to prototypes that displayed uncertainty.
This isn’t just about annoyance; it’s about safety. Dr. Brian Middleton, a health services researcher, warns that AI systems reasoning without appropriate confidence limits are reshaping our information ecosystem harmfully. He draws parallels to clinicians who over-relied on flawed electronic health record systems in the past. If your AI says "The capital of Australia is Sydney" with the same tone as "The capital of Australia is Canberra," you have no signal to pause and verify. That missing signal is where errors multiply.
Types of Uncertainty You Need to Know
To fix the problem, we first need to understand what we’re measuring. Uncertainty in AI generally falls into two buckets:
- Aleatoric Uncertainty: This is inherent randomness in the data. It’s like rolling dice-no matter how smart the model is, some outcomes are just probabilistic.
- Epistemic Uncertainty: This stems from the model’s lack of knowledge. The AI simply hasn’t seen enough relevant examples to be sure. This is the kind of uncertainty that leads to hallucinations.
Technical teams can quantify these using methods like Monte Carlo dropout or ensemble modeling. For instance, Pacific Northwest National Laboratory (PNNL) demonstrated that researchers could predict molecular binding affinities with 87.3% accuracy by explicitly modeling this uncertainty. But here’s the catch: these complex mathematical metrics rarely make it to the user interface. Most enterprise tools strip them out because developers fear confusing the end-user. This is a mistake. Hiding uncertainty doesn’t remove it; it just makes it invisible.

What Works: Visualizing Confidence
If hiding uncertainty is bad, what’s the alternative? Research suggests that simple, intuitive visual cues work best. You don’t need to show a user a probability distribution curve. You need to show them how much the model "knows."
A key finding from recent UX studies indicates that size is the most effective visual variable for communicating confidence. Larger text or icons indicated higher confidence, impacting trust decisions by nearly 38 percentage points. Color saturation and transparency were less effective, moving trust by only 22 and 18 points respectively. Furthermore, the optimal amount of screen real estate dedicated to these uncertainty indicators is between 22% and 35%. Any more, and you overwhelm the user; any less, and they miss the signal.
| Visualization Method | Impact on Trust Decision (Percentage Points) | Implementation Effort (Hours) | User Preference Score |
|---|---|---|---|
| Size Variation | 37.8 | 72 | High |
| Color Saturation | 22.1 | 105 | Medium |
| Transparency | 18.4 | 120 | Low |
| No Indicator | Baseline | 0 | N/A |
The Enterprise Reality Check
Despite the clear benefits, adoption in the business world is lagging. An audit by Panorama Consulting found that 89% of generative AI tools used in Fortune 500 companies sound confident even when their answers lack context. In supply chain planning, 71% of AI-generated forecasts failed to indicate confidence levels at all. One supply chain director rated her company’s AI tool 2.3 out of 5 stars specifically because it forecasted a 22.7% demand increase based on incomplete data from only three regional warehouses, with zero warning about that limitation.
This gap exists because implementing uncertainty features is hard. Google’s Metacognition in Generative AI project notes that quantifying uncertainty increases inference time by 40-60%. Companies are reluctant to sacrifice speed for clarity. Additionally, there’s a talent shortage: only 18% of AI developers report strong proficiency in uncertainty quantification methods. This means many organizations deploy AI without knowing how to measure its doubt.
How to Implement Better Communication
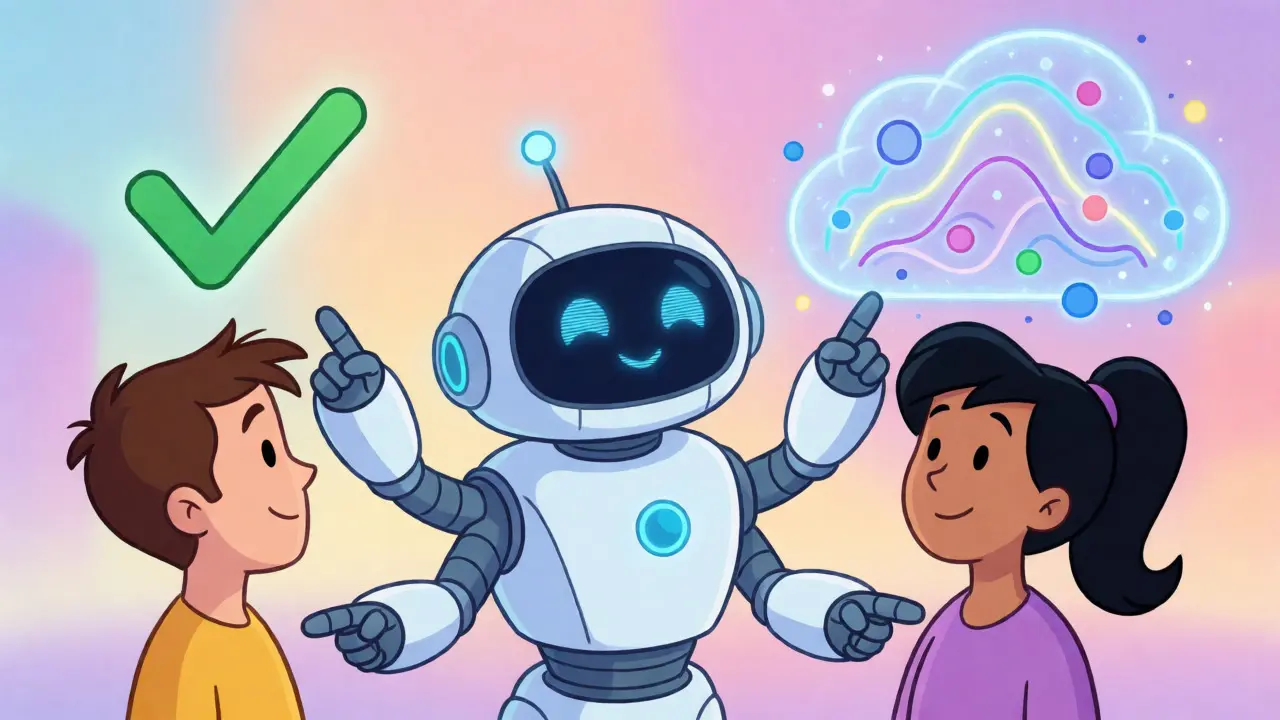
If you’re building or buying AI solutions, here is how you bridge the gap. First, align the visualization with the risk level. High-stakes medical decisions need explicit, detailed uncertainty indicators. Low-stakes creative writing tasks might get away with subtle cues. Second, match the complexity to the user’s expertise. Domain experts can handle nuanced probability scores, while general users need simple traffic-light systems (Green/Yellow/Red).
Third, avoid the "overwhelm" trap. A common pitfall is dumping raw data onto the screen. Instead, use contextual framing. For example, instead of saying "Confidence: 65%,", say "Based on limited recent data, this prediction has moderate confidence." This narrative approach helps users calibrate their trust correctly. MIT’s Human-Centered AI group found that such interpretability features improved trust calibration by 34.2% in high-risk scenarios.
Regulatory and Future Outlook
Pressure is mounting to get this right. The EU AI Act, implemented in July 2024, requires "appropriate communication of system limitations" for high-risk applications. This isn’t optional anymore; it’s compliance. Meanwhile, the market for AI explainability tools is booming, projected to hit $1.2 billion by 2027. Leaders in healthcare (37% adoption) and finance (29%) are already integrating these features, while education lags behind despite the high stakes of academic integrity.
The future lies in adaptive systems. Imagine an AI that changes how it displays uncertainty based on who is asking and what they are doing. If a novice asks a question, the AI simplifies the confidence signal. If an expert asks, it provides deeper technical details. Early beta tests of such adaptive interfaces show a 42.6% improvement in appropriate trust calibration. We are moving away from static confidence scores toward dynamic, context-aware conversations.
Why do LLMs appear so confident even when wrong?
Large Language Models are trained to maximize the likelihood of the next token in a sequence, which often results in fluent, grammatically correct sentences regardless of factual accuracy. They do not inherently possess a self-awareness module that flags low-probability responses, so they default to a neutral, authoritative tone unless explicitly prompted or fine-tuned to express uncertainty.
What is the difference between aleatoric and epistemic uncertainty?
Aleatoric uncertainty is inherent noise in the data that cannot be reduced by collecting more data (e.g., random weather events). Epistemic uncertainty arises from the model's lack of knowledge or training data gaps, which can be reduced by gathering more relevant examples. Distinguishing between them helps determine if the solution is better data collection or a different model architecture.
Do confidence scores in APIs mean the same thing across vendors?
No. There is no standardized definition of "confidence score" across AI providers. One vendor's 0.9 might mean a high probability of factual correctness, while another's 0.9 might simply reflect high lexical certainty (the words fit together well). Always check the documentation for how each specific API calculates and defines its uncertainty metrics.
How does uncertainty visualization affect user trust?
Proper visualization improves "trust calibration," meaning users learn to trust the AI when it is likely correct and distrust it when it is uncertain. Studies show that visual cues like font size or color intensity significantly impact decision-making quality, reducing inappropriate reliance on erroneous outputs by up to 47% in high-risk contexts.
Is adding uncertainty indicators expensive?
It adds computational overhead, typically increasing inference time by 40-60% depending on the method used (such as Monte Carlo dropout or ensembles). However, basic UI implementations like text-based disclaimers or simple color coding require minimal development time (around 72 hours), making it accessible even for smaller projects.


The entire premise of this article is fundamentally flawed and demonstrates a profound misunderstanding of how large language models actually function. You are conflating linguistic fluency with factual accuracy which is a rookie mistake that has been discussed in academic circles for years yet you present it as some new revelation. The "confident hallucination" problem is not a bug but a feature of next-token prediction architectures where the model optimizes for probability distribution rather than truth value. If you want certainty you use symbolic logic systems or deterministic databases not probabilistic generative models. Your suggestion to visualize uncertainty via font size is aesthetically pleasing but functionally useless for enterprise decision making because it adds cognitive load without reducing epistemic ambiguity. Furthermore the citation of the EU AI Act is misleading because compliance does not equal technical correctness and hiding behind regulation is exactly what lazy developers do when they cannot solve the underlying mathematical problems. This article reads like marketing fluff dressed up as analysis and fails to address the core issue that we lack ground truth data for open-ended generation tasks. Stop trying to humanize machines by giving them fake confidence scores and start building systems that refuse to answer when the probability mass is too diffuse.
totally agree with the point about visual cues being ignored!! i work in healthcare IT and we see this all the time where docs just skim past the little warning icons bc theyre in a rush. its scary how much trust people put into these black boxes without realizing the model might be guessing. maybe if we made the uncertainty more disruptive visually like flashing red or something they would actually pay attention? just a thought
OH MY GOD FINALLY SOMEONE SAYS IT!!!??? THEY ARE HIDING THE TRUTH FROM US!!!
Why do they make it look so confident?? Because they WANT us to rely on them so we stop thinking!!! It’s a conspiracy to lower our IQs!!! Look at the stats!!! 68% less critical thinking?! That’s not an accident that’s BY DESIGN!!! They strip out the error bars because they don’t want us to know they’re lying!!! We need to fight back against these corporate overlords who treat us like data points!!! Don’t let them fool you with their pretty fonts and smooth talk!!! Wake up!!!
Interesting read. I think the part about adaptive interfaces is the most realistic path forward though. Static indicators feel clunky but dynamic ones could actually help. Still worried about latency costs mentioned in the text.
I appreciate the balanced view here. As someone who coaches teams on digital adoption, I've seen how over-reliance creates skill decay. The suggestion to match complexity to user expertise is key. We need to teach users *how* to interpret these signals, not just display them. Otherwise, it's just noise.
You're missing the forest for the trees. Who cares about font sizes? The real issue is that we are outsourcing cognition to entities that have no concept of truth. You talk about 'trust calibration' like it's a solvable engineering problem. It's not. It's a philosophical crisis. And frankly, your table comparing implementation hours is laughable. Real-world integration takes months, not 72 hours. This article is naive at best and deceptive at worst. You're selling a band-aid for a gunshot wound.
I think there is a huge opportunity here for UX designers to really step up their game because right now most interfaces are just throwing raw probabilities at users which is confusing and frankly annoying for the average person who just wants a quick answer...
If you look at how weather apps handle uncertainty they use ranges and color gradients which people intuitively understand so why can't AI do the same thing instead of showing a decimal number that means nothing to me?
Also the point about regulatory pressure from the EU is interesting because it might force companies to actually invest in this stuff instead of just ignoring it until a lawsuit happens...
YES! Finally someone gets it!! We need to push back against the hype train!!! But honestly the tech side is way harder than this article makes it sound... adding those layers kills speed and nobody wants slow AI. Gotta find a balance or else we'll just ignore the warnings anyway bc convenience wins every single time. Keep fighting the good fight tho!