Running a large language model (LLM) in production isn't like running a simple web app. You can't just throw more CPUs at it and call it a day. If you do, you'll either burn through your cloud bill or watch your users wait for answers that should take half a second but take five. The key to making LLM services both affordable and fast? Autoscaling. But not the kind you know from old-school web services. LLMs need their own rules.
Why Traditional Autoscaling Fails for LLMs
Most companies started with Kubernetes Horizontal Pod Autoscaler (HPA) using CPU or memory usage. It worked fine for APIs that processed one request at a time. But LLMs don’t work that way. They batch requests. A single GPU can handle 10, 20, even 50 prompts at once if they’re queued properly. If you scale based on CPU usage, you’ll wait until the GPU is at 95% before adding another instance. By then, your queue is backed up, latency has spiked, and users are leaving.Google Cloud’s internal data shows that when GPU utilization hits 80%, latency can jump 230% if requests aren’t being batched efficiently. That’s not a hardware problem. It’s a scaling policy problem. Traditional metrics like CPU or even GPU utilization only tell you 63% of the story. The real bottleneck? How many requests are waiting to be processed - not how busy the chip is.
The Three Signals That Actually Matter
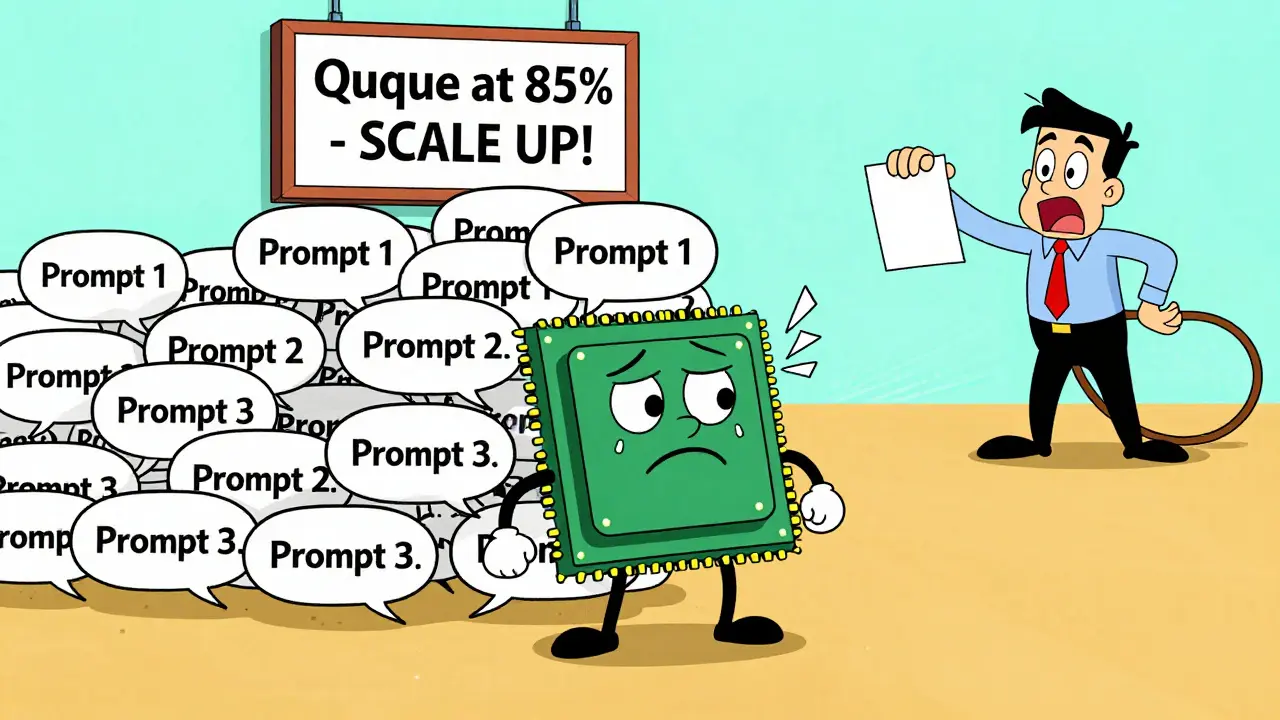
There are three metrics that give you real insight into whether your LLM service is about to break or has room to breathe. Forget what you learned from monitoring dashboards for web servers. These are different.- Prefill queue size: This is the number of incoming requests waiting to be processed before the model starts generating output. When this queue fills up, latency explodes. Google Cloud found that when the queue hits 70% of its max capacity, the 95th percentile latency increases by over 200%. Scaling up when the queue hits 85% gives you headroom to handle spikes without over-provisioning.
- Slots_used percentage: This measures how many processing slots are occupied in your model server. Each slot can handle one request in a batch. If 90% of slots are full, you’re at capacity. This metric reacts faster than queue size because it shows you’re running out of parallel processing space - not just that requests are piling up. CloudOptimo’s tests showed it cuts latency spikes by 47% during traffic surges.
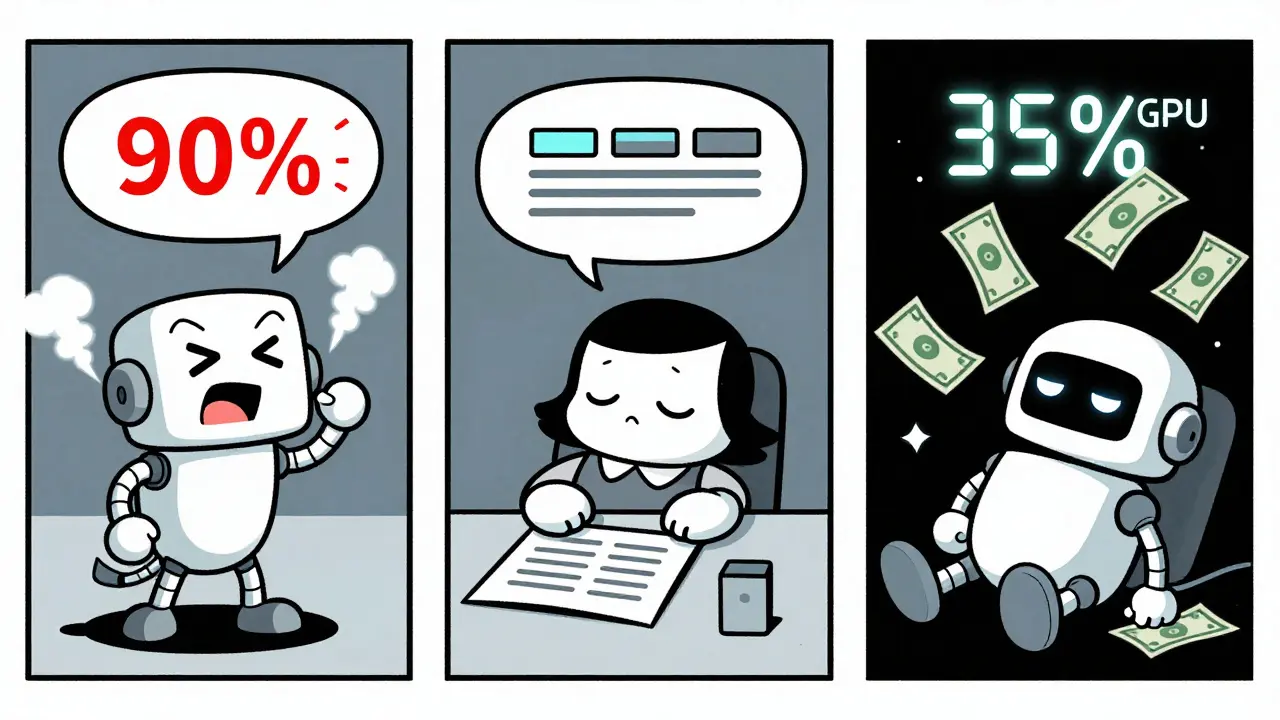
- TPU HBM usage: High Bandwidth Memory on TPUs is the actual fuel for token generation. Unlike GPU utilization, which can be misleading due to idle cycles, HBM usage correlates at 92% with tokens processed per second. If your HBM usage is low but your queue is full, you’re not using your hardware right. If it’s high and your queue is empty, you’re wasting money.
These aren’t optional. They’re the only signals that tell you what’s really happening under the hood. You can’t rely on CPU, RAM, or network metrics. They’re noise.
Choosing the Right Policy for Your Workload
Not all LLM services are the same. Your scaling policy should match your use case.Real-time chatbots (like customer support): You need sub-1-second responses. Here, slots_used is king. If even one slot is free, you should scale up fast. CloudOptimo’s benchmarks show this approach cuts 99th percentile latency by 38% compared to queue-based scaling. The tradeoff? You’ll spend 15% more on infrastructure. But if users abandon your chatbot after a 3-second wait, that cost is worth it.
Internal scoring engines (like document analysis or sentiment tagging): These can tolerate 2-5 seconds. Here, prefill queue size wins. You can wait until the queue builds up before spinning up new instances. Google Cloud found this method delivers 27% more throughput per dollar than fixed provisioning. It’s the sweet spot for cost efficiency.
Nightly batch jobs (like model evaluation or report generation): These are perfect for spot instances and aggressive scale-in. Set your scale-down trigger to 35% GPU utilization sustained for 8 minutes. Nexastack’s case study showed this cut costs by 68% compared to leaving instances running idle overnight.
There’s no one-size-fits-all. Pick the metric that matches your latency budget. If you can wait, optimize for cost. If you can’t, pay for speed.
The Cold Start Problem and How to Beat It
Scaling up sounds great - until you realize it takes 2 minutes to bring a new LLM replica online. That’s not a bug. That’s the reality of loading a 70B parameter model into GPU memory. YouTube engineer TSEGA demonstrated that standard Kubernetes deployments take 112-187 seconds to start a new replica. During that time, your queue keeps growing. Users get timeouts. You lose trust.The fix? Pre-warmed containers. Keep a few replicas running idle, ready to handle traffic. They don’t process requests - they just stay loaded. This reduces cold starts to 23-37 seconds. The catch? You’re paying for those idle instances 24/7. That adds 18-22% to your baseline cost. But for mission-critical services, it’s often cheaper than losing customers.
Some platforms now offer “warm standby” as a built-in feature. Baseten, OctoAI, and Google Vertex AI all let you specify minimum warm replicas. If you’re building this yourself, you’ll need to script it. Don’t ignore this. It’s the single biggest cause of poor user experience in LLM deployments.
Implementation Pitfalls and How to Avoid Them
You can have the perfect policy, but if you implement it wrong, it’ll cost you more than no autoscaling at all.- Too many scaling events: If your cooldown period is too short (under 3 minutes), you’ll get thrashing - scaling up and down every few minutes. YouTube’s data shows 67% of failed autoscaling setups suffer from this. Set cooldowns to at least 5 minutes for queue-based scaling, 8 minutes for hardware-based.
- Wrong thresholds: Scaling at 70% queue utilization instead of 85% doesn’t give you more headroom - it just makes you scale too early. CloudOptimo found this mistake increases costs by 28-35% without improving latency.
- Insufficient sampling: If your metrics are sampled every 30 seconds, you’re blind to sudden spikes. LLM traffic can double in 10 seconds. Sample every 5-10 seconds. Prometheus Adapter can handle this.
- No request collapsing: If five users ask the same question within 2 seconds, your system should process it once and return the same answer to all five. This reduces scaling events by up to 41%. Most open-source LLM servers like vLLM and TGI support this. Enable it.
Implementing this isn’t easy. Google Cloud estimates it takes 6.2 weeks for teams with Kubernetes experience to get it right. MIT’s AI Lab found it takes 8-12 weeks for teams without MLOps staff. If you’re starting from scratch, consider a managed platform. G2 Crowd data shows platforms with built-in autoscaling get 4.3/5 ratings - 0.6 points higher than DIY setups.

The Cost of Getting It Wrong
Poor autoscaling doesn’t just waste money. It kills user trust.Anthropic’s 2024 analysis found that 29% of unnecessary LLM infrastructure costs across enterprise customers came from misconfigured autoscaling. One Fortune 500 company reported a 42% cost reduction after switching to prefill queue scaling - but only after spending three weeks tuning thresholds. Another startup’s first attempt using slots_used caused 22% higher costs than fixed provisioning because of constant oscillation.
The market is catching on. Gartner reports that 68% of Fortune 500 companies now use some form of LLM autoscaling - but only 29% are happy with their cost-performance balance. The difference? The ones who got it right use custom metrics. The rest are still using CPU-based scaling and wondering why their bills are sky-high.
What’s Next? Predictive and Cost-Aware Scaling
The next wave isn’t just reactive. It’s predictive.Google Cloud rolled out predictive scaling in September 2024. It uses historical traffic patterns to anticipate surges - like a weekend spike in customer service queries - and scales up before the traffic hits. Their internal tests show it cuts scaling latency by 63%. That’s huge.
Even smarter? Cost-aware scaling. CloudOptimo’s November 2024 test showed that shifting workloads between spot instances, on-demand, and reserved instances based on real-time cost-per-inference reduced expenses by 44% for batch workloads. If your model can tolerate a 2-second delay, why pay $0.80 per hour for an on-demand GPU when a spot instance costs $0.25?
By 2025, Forrester predicts 75% of enterprise LLM deployments will use multi-metric policies combining queue size, hardware usage, and latency. Right now, it’s only 18%. The gap is closing fast. If you’re not building this into your architecture now, you’ll be playing catch-up by next year.
Final Takeaway
Autoscaling LLMs isn’t about more servers. It’s about smarter signals. You need to stop watching CPU and start watching queues, slots, and memory bandwidth. Pick your metric based on your latency tolerance. Fix cold starts. Avoid thrashing. And don’t try to build this alone unless you have dedicated MLOps engineers.LLM infrastructure is now a core business cost - not a technical experiment. Get the scaling right, and you’ll cut your cloud bill in half. Get it wrong, and you’ll pay twice as much for worse performance. There’s no middle ground.
What’s the best autoscaling metric for real-time LLM applications?
For real-time applications like chatbots or voice assistants that need sub-second responses, slots_used percentage is the most effective metric. It reacts faster than queue size because it directly reflects how many processing slots are occupied. CloudOptimo’s benchmarks show it reduces 99th percentile latency by 38% compared to queue-based scaling. The tradeoff is a 15% increase in infrastructure cost, but for user-facing services, that’s often justified.
Why is prefill queue size better than GPU utilization for scaling?
GPU utilization is misleading for LLMs because of batching. A GPU can be at 60% utilization but still have a full queue of requests waiting to be processed. Prefill queue size, however, directly measures how many requests are backed up before inference begins. Google Cloud found that when the prefill queue hits 70% of capacity, latency increases by 230%. This makes it a far more accurate predictor of performance degradation than GPU usage, which only shows 63% correlation with actual throughput.
Can I use CPU-based autoscaling for LLMs?
No. CPU usage has almost no correlation with LLM inference performance. LLMs are GPU/TPU-bound, not CPU-bound. Scaling based on CPU will cause you to delay scaling until it’s too late, leading to high latency and poor user experience. Even Google Cloud’s documentation explicitly warns against this approach. Use prefill queue size, slots_used, or TPU HBM usage instead.
How long does it take to implement custom LLM autoscaling?
For teams with Kubernetes and Prometheus experience, it takes about 6-8 weeks to implement a stable, production-ready autoscaling system. For teams without MLOps expertise, it can take 8-12 weeks or longer. The biggest time sinks are instrumenting custom metrics, calibrating thresholds, and avoiding scaling thrash. Many companies now use managed platforms like Vertex AI or Baseten to cut this time to days instead of weeks.
Is there a way to reduce autoscaling costs without sacrificing performance?
Yes - by combining cost-aware scaling with workload-aware policies. For batch workloads, use spot instances and aggressive scale-in (scale down at 35% utilization over 8 minutes). For real-time workloads, use pre-warmed replicas to avoid cold starts. Also, enable request collapsing to merge identical requests. CloudOptimo demonstrated a 44% cost reduction for latency-tolerant workloads by dynamically switching between instance types based on real-time pricing. These tactics don’t hurt performance - they optimize it.


So let me get this straight - we’re now paying $0.80/hour for GPUs just so some chatbot can answer ‘How do I reset my password?’ in under a second? Meanwhile, my cousin in Ohio is still using dial-up and he’s not even mad. This isn’t innovation, it’s performance art for VCs. And don’t even get me started on ‘request collapsing’ - you mean we’re just gonna lie to users and say their question was answered when it wasn’t? They’ll find out. People notice. They always notice.
It’s funny how we’ve turned something that should be about helping people into a metrics war. We’re so obsessed with queue sizes and slot percentages that we’ve forgotten why we built these models in the first place - to make life easier, not to optimize for a spreadsheet. The real tragedy isn’t the cost - it’s that we’re treating human interaction like a server load. If your customer abandons your chatbot because it took 3 seconds… maybe the problem isn’t the scaling. Maybe it’s the bot. Or maybe… we just don’t need it at all.
This whole thing is overengineered. Just use less AI.
OMG I CANNOT BELIEVE THIS IS STILL A THING. Like, why are we even talking about CPU? 😭 I mean, it’s 2025 - we’re running 70B PARAMETER MODELS and people are still using ‘traditional autoscaling’? That’s like using a flip phone to video call Mars. I had a client last week who was using HPA with CPU thresholds - and guess what? Their users were getting 8-second responses. EIGHT. SECONDS. I screamed. I threw my laptop. I cried. Then I switched to slots_used and now their 99th percentile is 0.7s. I’m not even joking. It’s like night and day. Also - WARM REPLICAS. YOU NEED THEM. IF YOU DON’T HAVE THEM, YOU’RE DOING IT WRONG. 💥
I read this whole thing and I just… feel sad. Not because it’s wrong - it’s actually really well-written - but because it feels like we’ve lost the humanity in all of this. We’re building systems that can predict when a user will leave based on queue depth, and we’re optimizing for cost-per-inference like it’s a stock trade. But behind every request is someone who’s confused, scared, lonely, or just trying to get their work done. I wish we spent as much time thinking about how to serve them well as we do about how to shave 18% off our cloud bill.
Canada doesn’t need this. We have universal healthcare. We don’t need to pay for 15% more GPU just to make some American startup’s chatbot ‘feel fast.’ This is capitalism running wild. Stop pretending LLMs are magic. They’re just fancy autocomplete. Use fewer of them. Or better yet - don’t use them at all. We’ve been doing fine without AI for 200 years.
Just wanted to say - this is actually really helpful. I’ve been struggling with this at work, and the part about prefill queue size was a lightbulb moment. We were using GPU utilization like everyone else, and our latency was all over the place. Switched to queue size + slots_used, added warm replicas, and boom - 60% drop in p99 latency. No fancy AI, no magic. Just paying attention to what actually matters. Also, request collapsing? Game changer. We had 30% of requests being the same question from the same user. Why process it 5 times? Duh. Thanks for writing this.