You built a chatbot. It sounds confident. It answers questions about your product specs or legal policies. But how do you know it’s not making things up? In 2023, OpenAI revealed that even their top-tier models hallucinated between 26% and 75% of the time, depending on how you measured it. If you’re running an LLM in production today, guessing isn’t an option. You need hard numbers.
By late 2025, Hallucination Rate has become as critical to AI engineering as uptime is to web servers. Gartner predicts that by 2026, 75% of enterprise deployments will track this metric specifically. Why? Because Microsoft found a direct link: when hallucination rates exceed 15%, customer dissatisfaction spikes by over 30%. This article breaks down exactly how to measure this rate, which metrics actually work, and how to build a dashboard that saves you from compliance nightmares.
Why Traditional Metrics Fail at Factuality
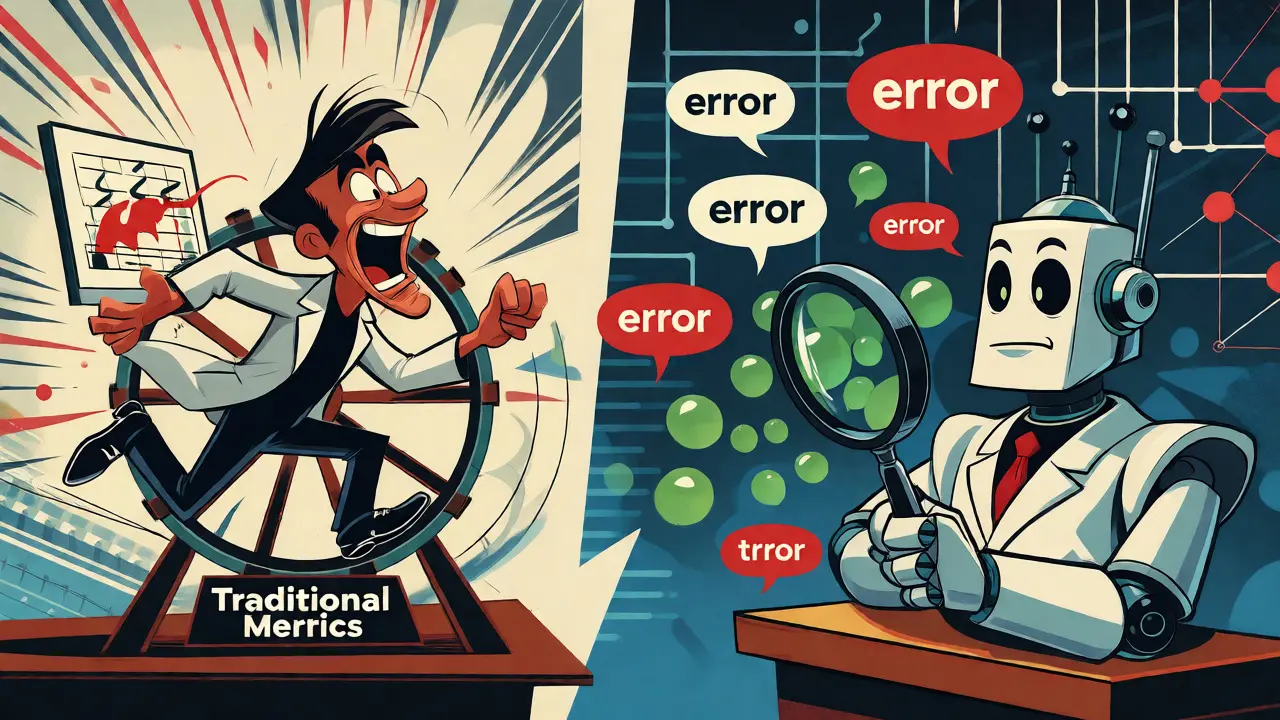
If you’re still using ROUGE, BLEU, or BertScore to check if your LLM is accurate, you’re flying blind. These metrics measure linguistic similarity-how close the output looks to a reference text-not whether the facts are true. A model can score 95+ on BertScore while hallucinating 40% of its claims. It happens because these tools reward fluency, not truth.
To fix this, we look at RAGAS (Retrieval-Augmented Generation Assessment). Unlike traditional NLP metrics, RAGAS focuses on Faithfulness, which calculates the fraction of claims in the answer that are supported by the provided context. Recent benchmarks show RAGAS achieves an AUROC (Area Under the Receiver Operating Characteristic curve) of 0.78-0.82 across various model sizes. That’s a solid baseline, but it’s not perfect. In medical datasets, for example, RAGAS underperformed by 18% compared to financial datasets, showing that one size does not fit all.
The Rise of Semantic Entropy
Enter Semantic Entropy. Introduced in a major Nature paper in April 2024, this method measures uncertainty differently. Instead of just looking at token probabilities, it analyzes the semantic consistency of multiple generated answers. If the model gives you five different ways to say the same fact, entropy is low. If it gives you contradictory facts, entropy is high.
This approach is powerful because it works without needing a "ground truth" answer key, which you rarely have in production. The study showed consistent performance with an AUROC of 0.790 across models ranging from 7B to 70B parameters, including LLaMA and Mistral families. For production teams, this means you can filter out the top 20% of highest-entropy answers and maintain over 80% accuracy on the remaining responses. It’s a practical way to balance coverage against quality.
LLM-as-a-Judge: The Scalable Checker
For many teams, the most accessible solution is LLM-as-a-Judge. Here, you use a stronger model (like GPT-4o) to evaluate the outputs of your production model. Datadog implemented this in late 2024 and achieved an F1 score of 0.844 on the HaluBench dataset. However, there’s a catch: latency. Evaluating each response adds ~350ms per request. If you’re handling more than 50 requests per second, this becomes expensive and slow unless you have dedicated infrastructure.
Despite the cost, it’s highly effective for post-hoc analysis. You don’t run it on every single query in real-time. Instead, you sample 10-20% of traffic and let the judge model flag potential issues. This tiered approach allows you to keep user-facing latency low while still catching systematic errors.
| Metric / Method | AUROC / F1 Score | Best Use Case | Latency Impact |
|---|---|---|---|
| Semantic Entropy | 0.790 AUROC | Real-time filtering without ground truth | Low (Local computation) |
| RAGAS Faithfulness | 0.78-0.82 AUROC | RAG systems with known context | Medium (API calls) |
| LLM-as-a-Judge | 0.844 F1 (HaluBench) | High-accuracy batch evaluation | High (~350ms per eval) |
| TLM (Truthful LM) | +15-22% Precision vs Judge | Complex reasoning tasks | Variable |
Building Your Dashboard: Tiered Monitoring
So, what goes on the screen? Successful deployments in 2025 follow a tiered pattern. You don’t try to measure everything at once. Instead, you layer your defenses.
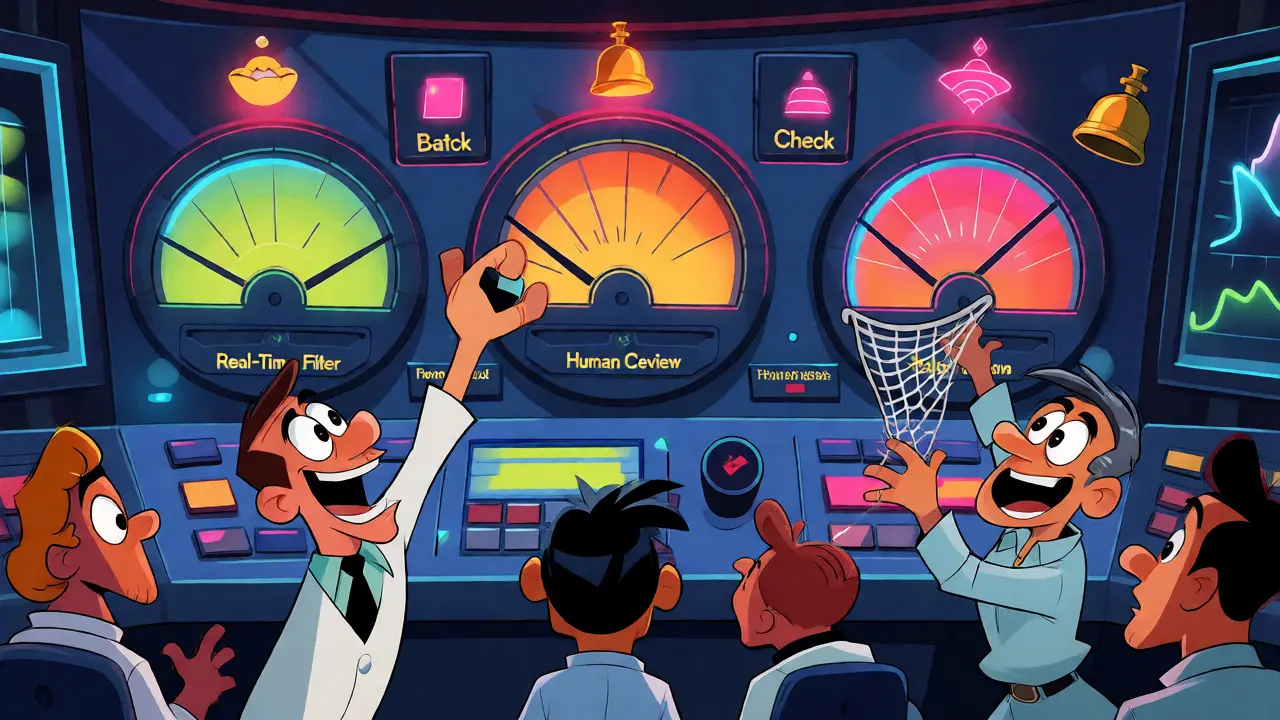
- Tier 1: Real-Time Filtering (100% Traffic). Use Semantic Entropy or log-probability checks here. If entropy is too high, you might trigger a fallback message like "I'm not sure about that detail," rather than serving a potentially wrong answer. This protects the user experience immediately.
- Tier 2: Batch Evaluation (10-20% Sample). Send sampled logs to RAGAS or DeepEval. Calculate Faithfulness scores daily. Track trends. Is the rate creeping up after a model update? This is where you spot regressions.
- Tier 3: Human-in-the-Loop (1-2% Edge Cases). Flag responses where automated metrics disagree or confidence is borderline. Send these to human reviewers. Their feedback helps recalibrate your thresholds.
A common pitfall? Setting thresholds too tight. Datadog reported that 63% of enterprise clients initially set thresholds so low that they triggered excessive false positives, reducing system usability by 19%. Start loose, then tighten based on actual business impact.
Calibrating Thresholds for Your Domain
There is no universal "good" hallucination rate. Capital One’s 2025 case study showed optimal threshold variance between 0.65 and 0.82 depending on the financial domain. For creative content, a higher tolerance might be acceptable. For medical advice, it must be near zero.
One healthcare startup found that RAGAS Faithfulness scores below 0.65 correlated with 92% of their regulatory compliance issues. They used this specific number to trigger alerts. Your job is to find your own correlation. Map your hallucination metrics to business KPIs: customer support tickets, legal review costs, or churn rates. A fintech CTO noted that integrating semantic entropy helped reduce legal review costs by $280,000 annually by catching fabricated data before it reached customers.
Regulatory Pressure and Future Standards
You might think this is just an engineering problem. It’s becoming a legal one. The EU AI Act’s Article 15, taking effect in January 2026, requires technical solutions to mitigate risks of generating false information. 73% of European enterprises are already initiating monitoring programs to comply. Similarly, the upcoming NIST AI Risk Management Framework update in Q2 2026 will likely standardize these protocols for government contractors.
Looking ahead, expect convergence. By 2027, we’ll likely see three standard categories of metrics: real-time filters, post-hoc analyzers, and training-time indicators. Tools like Patronus AI and Confident AI are leading the commercial space, but open-source options like RAGAS remain dominant among technical teams due to flexibility.
What is a good hallucination rate for production?
It depends on your risk tolerance. For high-stakes fields like finance or medicine, aim for below 5%. For general chatbots, 10-15% is often acceptable if the tone remains helpful. Microsoft’s data suggests dissatisfaction spikes above 15%, so keeping it under that line is a safe initial target.
Can I use ROUGE to detect hallucinations?
No. ROUGE measures overlap between words, not factual correctness. A model can paraphrase a lie perfectly well and get a high ROUGE score. Always use factuality-specific metrics like RAGAS Faithfulness or Semantic Entropy.
How much does LLM-as-a-Judge cost?
Costs vary by provider, but using GPT-4o for judging adds significant API costs and latency (~350ms). It’s best used for sampling 10-20% of traffic rather than evaluating every single request in real-time.
What is Semantic Entropy?
Semantic Entropy measures the uncertainty of an LLM's output by analyzing the consistency of multiple generated responses. High entropy indicates conflicting information, suggesting a higher likelihood of hallucination. It works without needing a correct answer key.
Do I need separate dashboards for different models?
Yes, if you use multiple models. Different architectures (e.g., LLaMA vs. GPT) have different hallucination profiles. Calibrate thresholds separately for each model family to avoid false alarms.